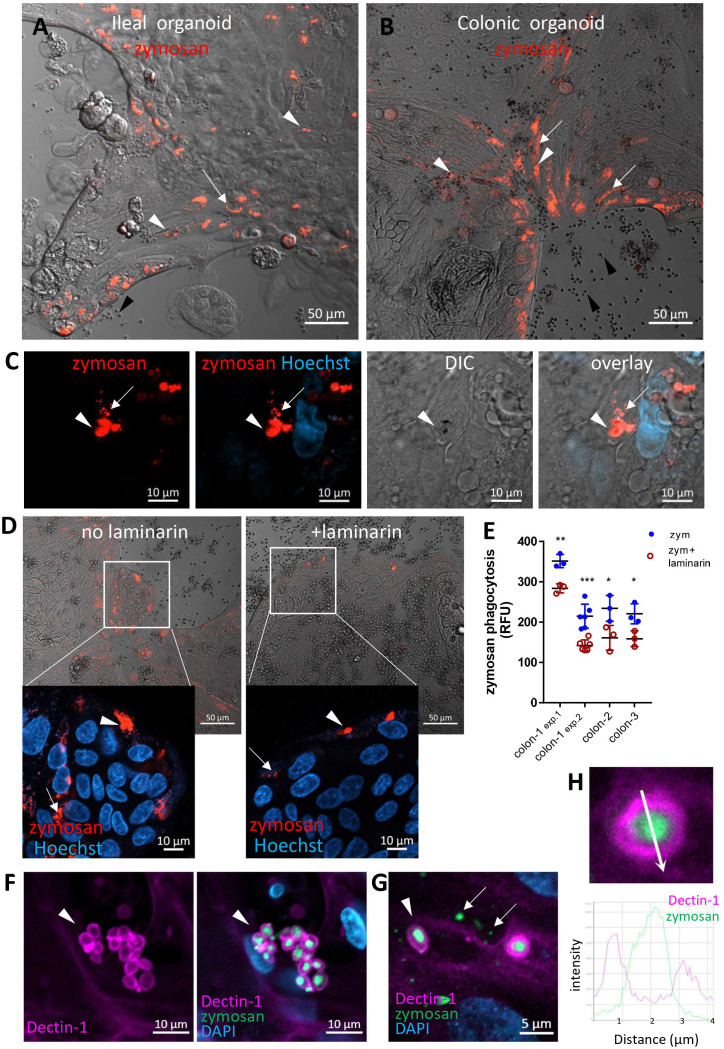
Figure 2.
Intestinal organoids uptake zymosan. (A, B) Ileal (A) and colonic (B) organoids were grown as monolayers in expansion medium and let to differentiate for 2 days. pHrodo-red zymosan (red) was added to the medium for 24h. Original magnification x10, scale bar 50 µm, white arrows and arrowhead indicate intracellular processed and intact zymosan respectively. Black arrowheads indicate extracellular zymosan. Shown are representative frames from wider fields, presented in Supplementary Figures S4, S5A , from 3-5 randomly acquired scans of two independent experiments of two organoids. (C) Colonic organoids (from a different individual) were treated as in (B), nuclei were stained with Hoechst 33342 (blue) prior to confocal live imaging. Shown a representative frame from a z-stack analysis. Entire z-stack movie is shown in Supplementary Movie 1 . Arrows and arrowhead indicate intracellular processed and intact zymosan respectively. Original magnification x63, scale bar 10 µm. (D) Laminarin inhibits zymosan uptake by intestinal organoids. Colonic organoids were grown as in B, in the presence or absence of laminarin (1 mg/ml) that was added to the medium 1 hour prior to zymosan in triplicate wells. Shown are intracellular fluorescent zymosan (red) and the organoid cells (DIC), or zoom-in insets where nuclei were stained with Hoechst 33342 (blue) prior to confocal live imaging. Shown are representative frames from 3-6 random fields imaged from each of triplicate wells. The experiment was repeated with organoids from four individuals. Original magnification x20, scale bar 50 and 10 µm, Arrows and arrowhead indicate intracellular processed and intact zymosan respectively. (E) Colonic organoids from three individuals (colon-1 to colon-3) were seeded in 96 well plate, treated as in (D) in triplicate or 6-replicate wells for 48 hours. Phagocytosis was assessed as the relative fluorescence by a microplate reader. Data are shown as the measured value (dots) and mean ± SD of biological replicates from four independent experiments performed. Colon-1 was tested twice (exp.1 and 2), zym=zymosan. ***p<0.001, **p<0.01, *p<0.05 vs. no inhibitor, Student’s t-test was performed individually for each independent experiment. (F, G) Dectin-1 is recruited to internalized zymosan. Ileal organoids were fed with AF488-zymosan (green) overnight and stained with Dectin-1 antibody (magenta) and DAPI. Original magnification x20 scale bar 10 µm (F) and x63 scale bar 5 µm (G). Arrowheads – intact zymosan, arrows- fragmented zymosan. (H) Fluorescence intensity profile along the arrow of an inset from (G) is shown on the graph.

