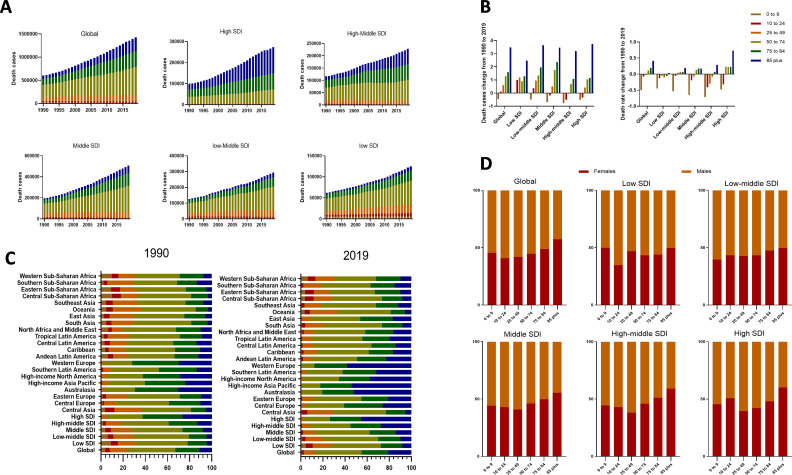
Figure 3.
The distribution of CKD death cases and rates in age groups, SDI areas and 21 geographic regions from 1990 to 2019. (A) Death cases in age groups in global and SDI areas from 1990 to 2019. (B) The change percentage of death cases (right) and rate (left) in age groups from 1990 to 2019. (C) Six age groups as percentages of total deaths in global, SDI areas and 21 geographic regions in 1990 and 2019. (D) Gender composition of death in global and SDI areas in 2019. CKD, chronic kidney disease; SDI, sociodemographic index.

