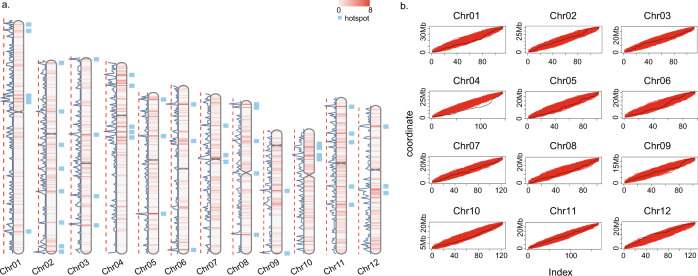
Fig. 2. Genome-wide inversion distribution.
a Chromosome distribution of the pan-genome inversion index, and inversion hotspots. Chromosome heatmaps in the middle along the chromosome represent the density of inversions. The line on the left of each chromosome represents the number of inversions per 200 Kb window. The red dotted line cut off is the top 2% number of inversions in per 200 Kb window. The blue boxes on the right of each chromosome represents the inversion hotspot regions. b The Kolmogorov–Smirnov (KS) test for inversion uniformity distribution across the 12 rice chromosomes. The black line is actual inversion distribution, and the red line is the 10,000th uniformly distributed simulation. Source data are provided as a Source Data file.

