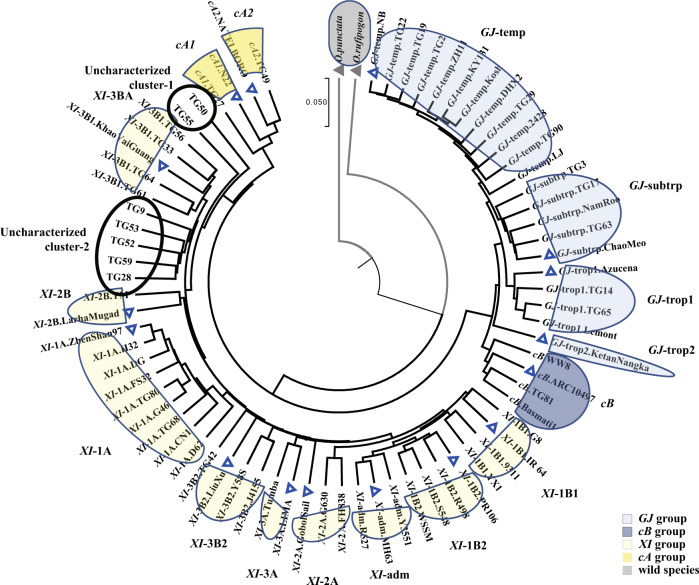
Fig. 3. Phylogenetic tree of 75 high-quality rice genomes using the pan-genome inversion index.
Phylogenetic relationships of the 75 high-quality genomes used to create the pan-genome inversion index, inferred using the UPGMA method (unweighted pair group method with arithmetic mean95). The tree is drawn to scale, with branch lengths in the same units as those of the evolutionary distances used to infer the phylogenetic tree. Evolutionary analyses were conducted in MEGA796. Two wild relatives (O. rufipogon and O. punctata) were heighted with light gray arc. Subpopulations from GJ, cB, XI, and cA groups were highlighted with light blue, dark blue, light yellow and dark yellow, respectively. Two uncharacterized XI subpopulations are shown with a black circle. The distance matrix of SNP and INV polymorphisms was significantly correlated (Mantel test, simulation with n = 999,999, r = 0.79, p = 1e−6). Source data are provided as a Source Data file.

