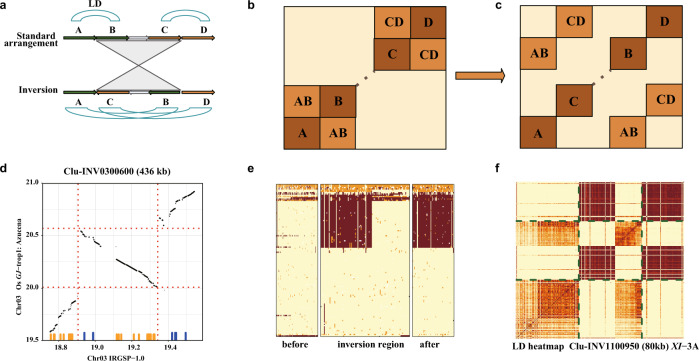
Fig. 7. Population linkage disequilibrium analysis of large inversions.
A schematic diagram of linkage disequilibrium (LD) block disruption arising from the presence of an inversion, as shown in A and B. a Cartoon view of an inversion with breakpoints disrupting two LD blocks; b Expected features of the corresponding LD heat map; c Example of SNP blocks in high LD that are disrupted by an inversion; d The panel shows alignments, with the inversion marked by dotted lines. Small vertical lines above the horizontal axis mark the location of SNPs constituting a disrupted LD block. Orange and blue colors delineate two LD blocks that are contiguous in the of GJ-trop1 population, but appear as split when aligned to the IRGSP RefSeq (GJ-temp). Disruption of Azucena (GJ-trop1) haplotype blocks along the IRGSP RefSeq in the region of INV030410, as shown in e and f; e Genotype heat map of the GJ-trop1 subpopulation (samples in rows, SNPs in columns; light yellow: reference call, orange: heterozygous, brown: homozygous variant); f LD heat map of the same subpopulation. Dotted lines show the inversion region. Darker colors show larger r2. Note that the scaling of X-axis in the genotype heat map is not uniform, allotting half of X-axis space to the inverted region. Source data are provided as a Source Data file.

