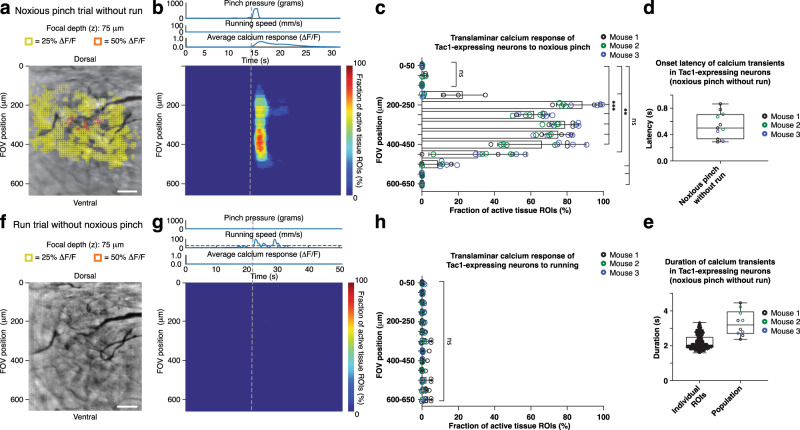
Fig. 5. High-speed translaminar imaging reveals noxious mechanical stimulus-evoked activity in the spinal cord of behaving Tac1-GCaMP6f mice.
a Average intensity projection image from a Tac1-GCaMP6f mouse (Supplementary Fig. 10) at 75 μm focal depth overlaid with 10 μm × 10 μm ROIs. Only ROIs with at least 25% (yellow) or 50% ∆F/F (orange) in response to a noxious tail pinch (p > 500 g; duration: 1.5 s ± 0.5 s) are shown. In this example, the tail pinch did not evoke a locomotor response. Scale bar, 100 μm. b Noxious tail pinch evoked activity across tissue depth and time for the example recording shown in panel a and Supplementary Movie 5. Each row depicts the percent of active ROIs (≥25% ∆F/F) for a given tissue depth (Methods). The applied pressure stimulus, locomotor activity, and average calcium transient across the FOV are shown above the activity heat map. The vertical dashed line indicates pinch onset. c Population data showing the average percent of active ROIs across tissue depths. Significant activity occurred in FOV regions corresponding to the upper spinal laminae (Fig. 4a, b). d Population data showing the average calcium transient onset latency for pinch-only trials. e Population data showing individual and average calcium transient duration for pinch-only trials. f Activity map from the same animal as in a for a spontaneous run trial without pressure stimulus application. Same focal depth as in a. Scale bar, 100 μm. g Running-evoked activity across tissue depth and time. The pressure sensor readout, locomotor activity, and average calcium signal across the FOV are shown above the activity heat map. The vertical dashed line indicates run onset. h Population data showing the average percent of active ROIs across tissue depth for run-only trials. No significant calcium activity occurred within the FOV in response to running. The data in c, d, e are from 1299 ROIs, 11 recordings, and three mice, while the data in h are from 8 recordings in three mice. All shown data were acquired four weeks after microprism implantation. Two-sided paired t-tests determined P values, and all bar plots are presented as mean ± s.e.m. The box and whisker plots mark the median and the 25th and 75th percentiles, and the whiskers cover the minimum and maximum of the data. All images are representatives from one sample. Images with similar properties were obtained across multiple independent samples. Source data are provided as a Source Data file.

