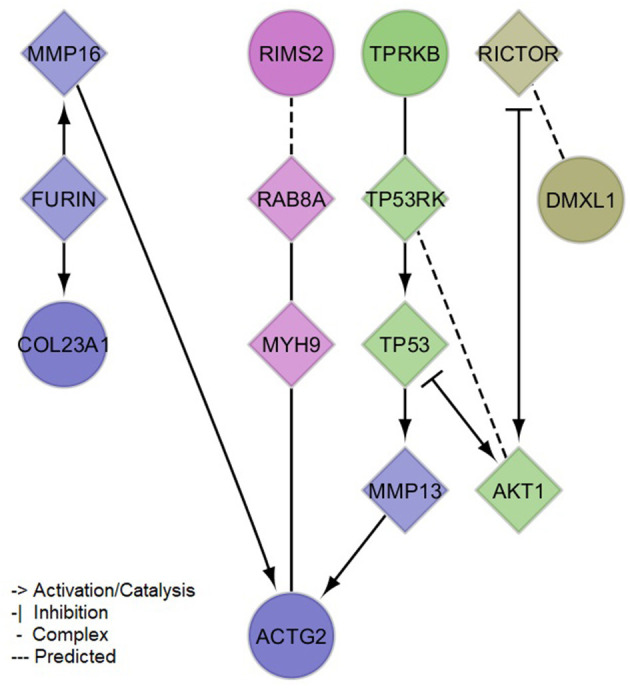
Figure 3.

Protein-protein interaction network of mapped and brain expression quantitative trail loci genes implicated by the identified (meta-analysis) suggestive loci for serum neurofilament light chain. Circles denote input genes. Diamonds denote linker proteins. Colors denote network clusters, whose enrichments for pathways and gene ontology cellular compartments can be found in the Supplementary material 2, Supplementary Tables 4, 5.
