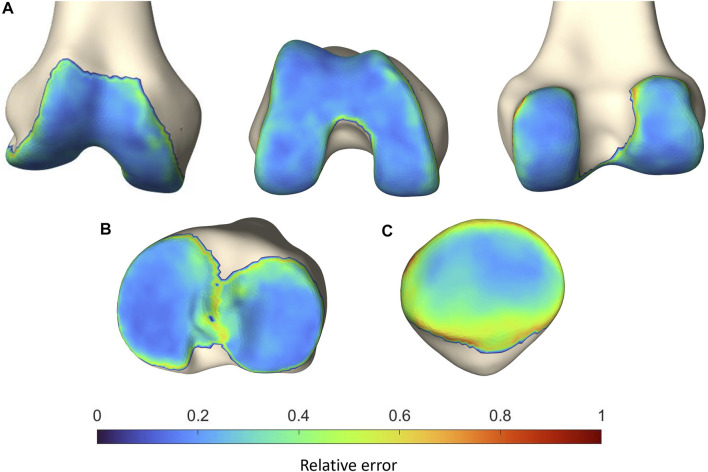
FIGURE 10.
Representation of the vertex-specific relative error in cartilage thickness prediction on (A) the mean femur, (B) the mean tibia and (C) the mean patella, extracted from the SSM. Color-coding ranges from blue (absent error) to red (error equaling the point-dependent mean cartilage thickness).

