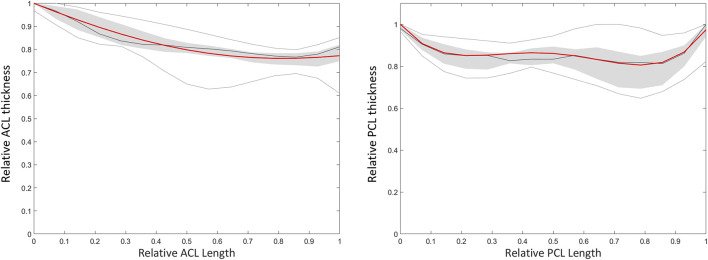
FIGURE 11.
Polynomial fitting for ACL and PCL thickness prediction. The median thickness of the ACL (left) and PCL (right) is presented as the dark grey line. The grey zone represents the values between P25 and P75. The light grey lines represent minimal and maximal values. The red line represents the thickness based on a respectively 2nd and 4th degree polynomial function for the ACL and PCL.

