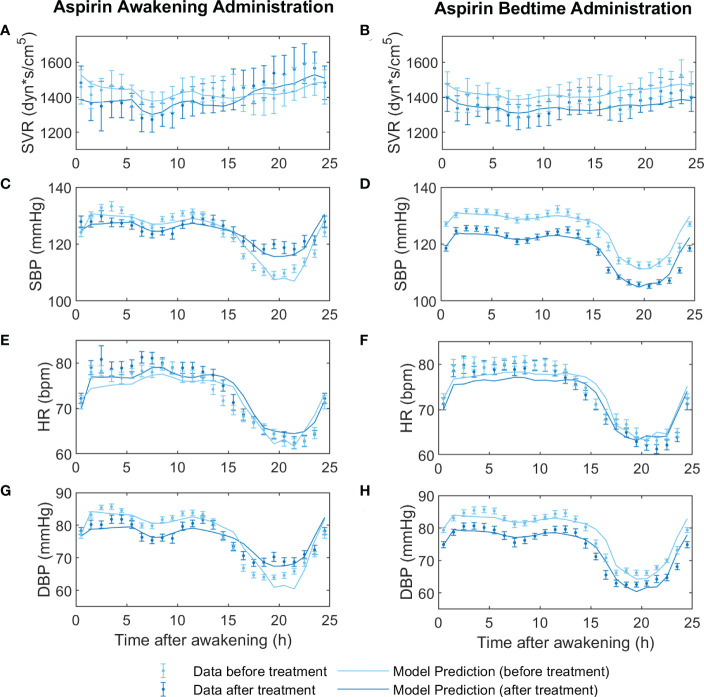
Figure 2.
Fitting models to data before and after aspirin treatment at awakening (on the left) versus at bedtime (on the right). Before-treatment data from AM and PM administration groups were fitted independently, to a non-Ta dependent effect model. After-treatment data were fitted to the Ta-dependent effect model, both awakening and bedtime administration simultaneously. In panels (A, B) the dynamics of the experimental data (light red points for before treatment and dark red points for after treatment) and predictions of the models (light red line for before treatment and dark red line for after treatment) of systemic vascular resistance (SVR), (C, D) systolic blood pressure (SBP), (E, F) heart rate (HR), and (G, H) diastolic blood pressure (DBP) are displayed.

