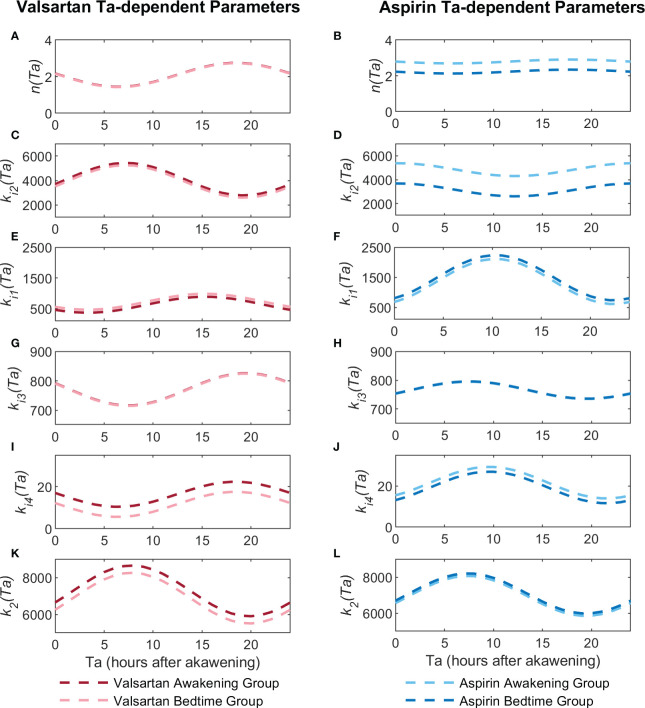
Figure 3.
Ta-dependent parameter profiles (p(Ta)) for the valsartan and aspirin models. Figures (A, C, E, G, I, K) show the parameter profiles of the n, k i2, k i1, k i3, k i4 and k 2 for valsartan, respectively. Figures (B, D, F, H, J, L) show the parameter profiles of the n, k i2, k i1, k i3, k i4 and k 2 for aspirin, respectively.

