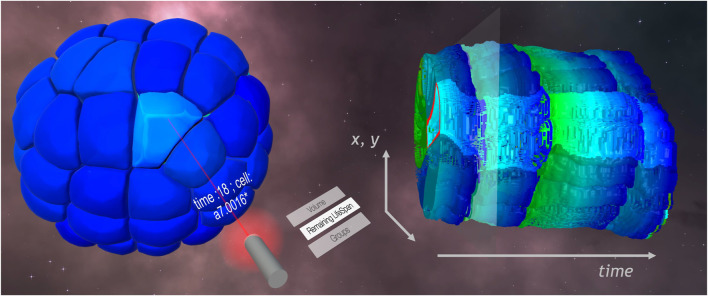
FIGURE 3.
STC (right) and meshed model (left) visualizations in the VR framework. On the laser selector, a list of available information allowed the user to color map the remaining lifespan of cells on the visualizations. A cell is selected on the meshed model. The name of the cell is displayed on the pointer, and feedback appears on the STC, highlighting the lineage of the cell.

