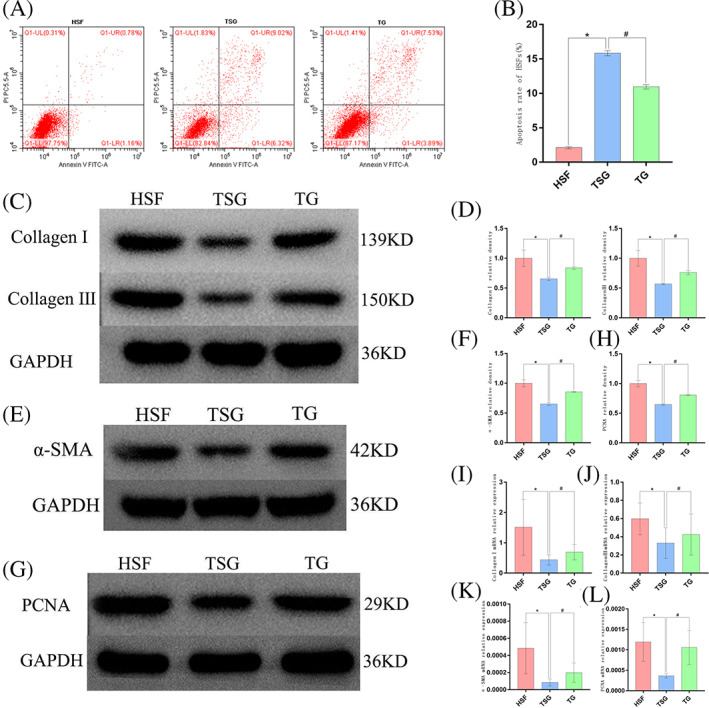
FIGURE 7.

The impact of TSG‐6 on HSF proliferation and apoptosis was suppressed following TG treatment‐mediated ER stress induction. (A) Representative flow cytometry plots from analyses of HSF apoptosis rates. (B) Quantification of HSF apoptosis rates. (C), (D) Western blotting analysis of Collagen I and Collagen III levels. (E), (F) Western blotting analysis of α‐SMA levels. (G‐H) Western blotting analysis of PCNA levels. (I‐L) Collagen I, Collagen III, PCNA, and a‐SMA expression were analysed via RT‐PCR. Data are means ± SD (n = 3/group). *P < 0.05 vs HSF group, # P < 0.05 vs TSG group
