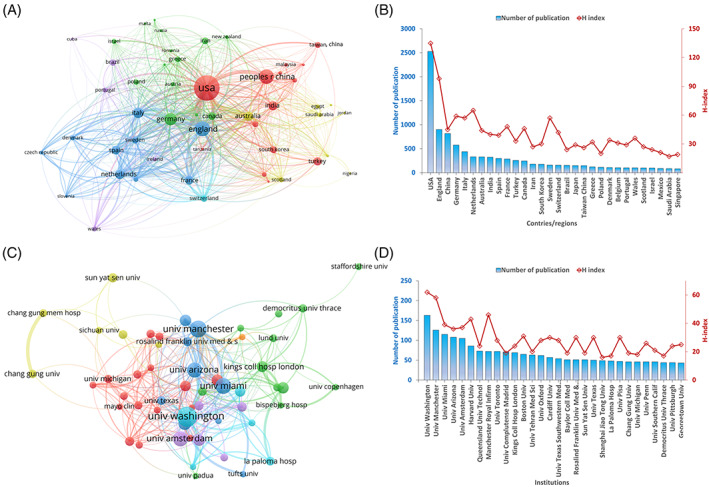
FIGURE 3.

Cooperation between countries/regions and institutions. A, The countries/regions co‐authorship network contains 52 nodes and 648 links. The size of the nodes and lines represent the number of publications and cooperation, respectively, in a country/region. Different coloured lines represent six different clusters. B, The number of publications and the H‐index scores, based on countries/regions. C, The institution co‐authorship network contains 55 nodes and 358 links. The node size and line represent the number of publications from the institution and their cooperation, respectively. Different coloured lines represent seven different clusters. D, The number of publications and the H‐index scores of the institutions
