FIGURE 4.

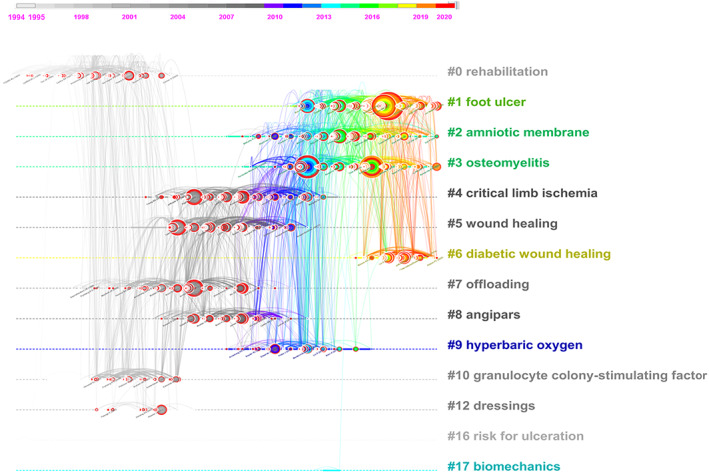
Timeline view of co‐cited references. The node size represents the total number of references, and the node colour represents the time slice. Different coloured lines indicate that two articles were co‐cited in one article

Timeline view of co‐cited references. The node size represents the total number of references, and the node colour represents the time slice. Different coloured lines indicate that two articles were co‐cited in one article