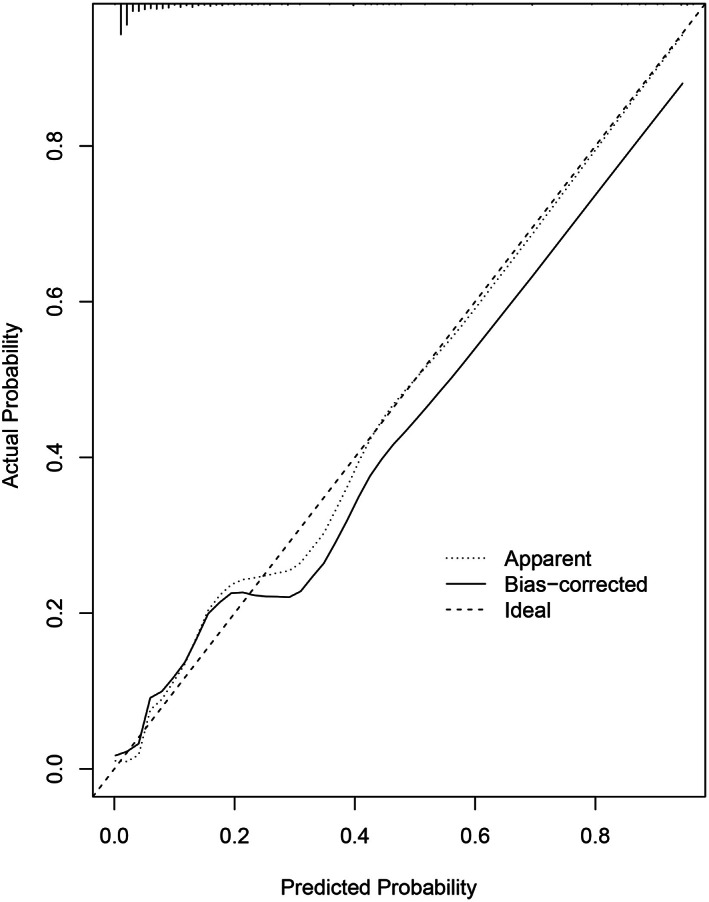
FIGURE 3.

Calibration plots of nomogram models for predicting postoperative surgical site infection in the training cohort. Nomogram‐predicted probability of SSI is plotted on the x‐axis; the actual probability of SSI is plotted on the y‐axis. A plot along the 45° line would indicate a perfect calibration model in which the predicted probabilities are identical to the actual outcomes
