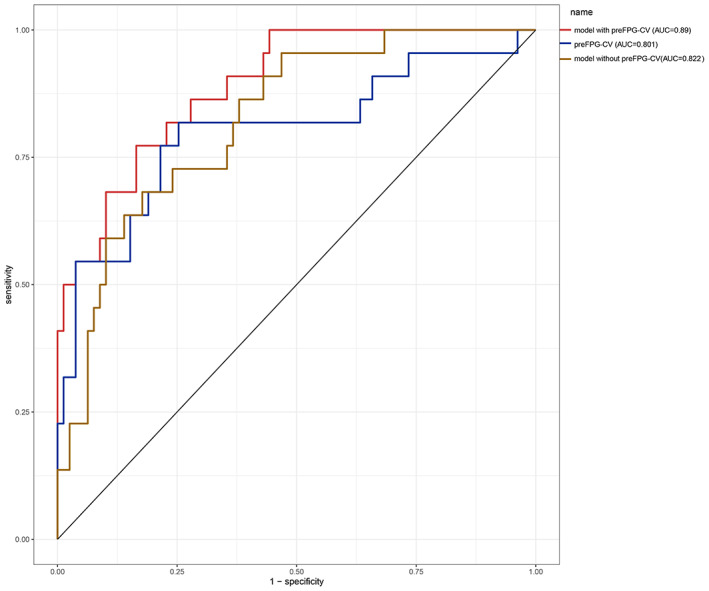
FIGURE 6.

ROC curves of the validation cohort. preFPG‐CV: preoperative FPG‐CV. ROC curves of the predicting SSI nomogram showed that the AUC of the model with preFPG‐CV, preFPG‐CV, the model without preFPG‐CV in the validation cohort was 0.890, 0.811, and 0.822 respectively
