FIGURE 3.

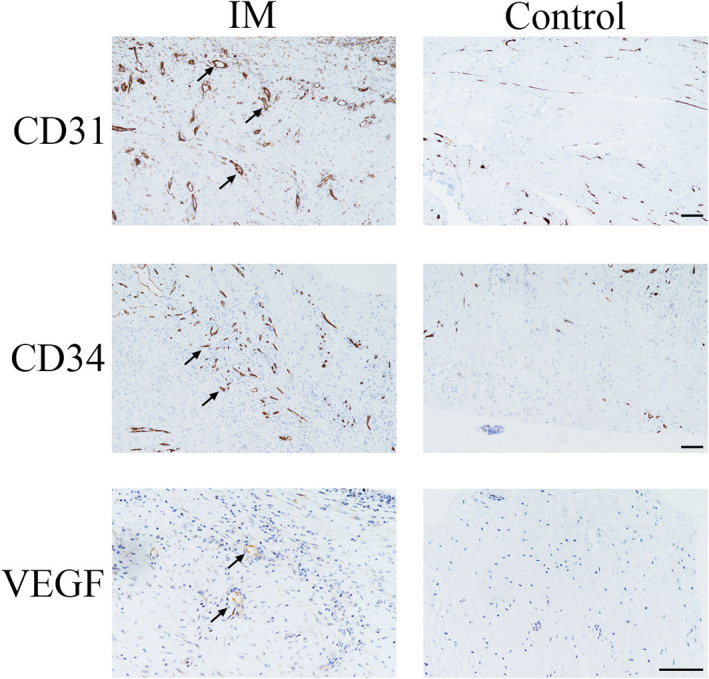
Immunohistochemical analyses of vascular endothelial growth factor (VEGF), CD31 and CD34 protein levels in the induced membrane (IM) and control. Black arrows indicate positive cells. Scale bar: 500 μm

Immunohistochemical analyses of vascular endothelial growth factor (VEGF), CD31 and CD34 protein levels in the induced membrane (IM) and control. Black arrows indicate positive cells. Scale bar: 500 μm