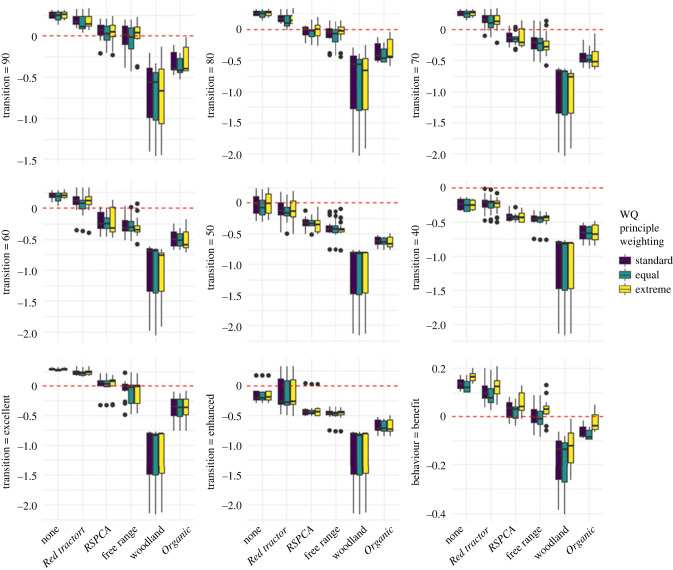
Figure 4.
Welfare costs according to several metrics with varying criteria determining the transition from welfare cost to welfare benefit (T in equation (2.2)). Upper and lower whiskers extend to 1.5 times the interquartile range. The middle horizonal bar is the median. The red dotted line is set at 0—with scores above the line being costs, and below being negative costs—i.e. benefits. Pairwise significant differences from a Dunn's post hoc analysis can be found in the electronic supplementary material, table S1.

