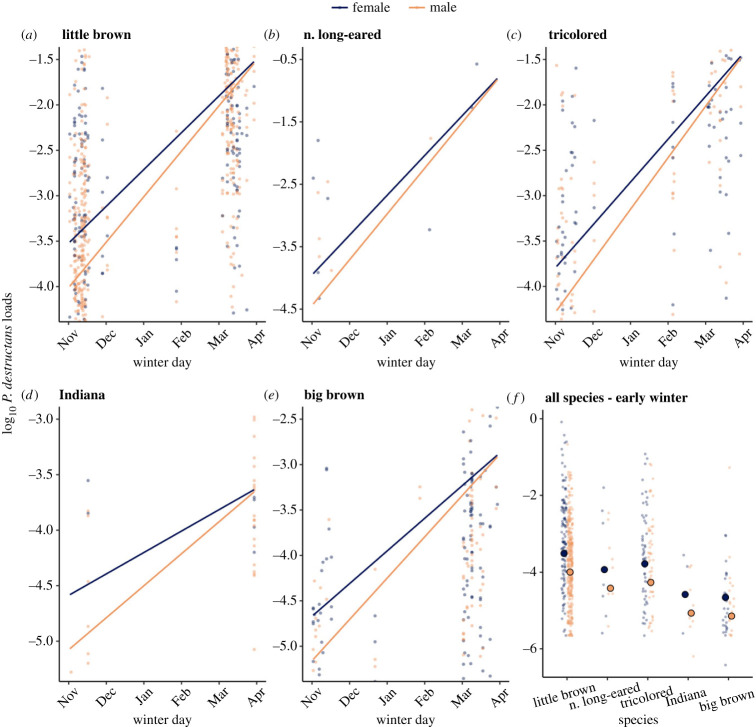
Figure 2.
(a–e) Change in P. destructans infection severity (fungal loads) over winter by sex for each of the five host species. A point represents an individual bat, and females and males are shown in blue and orange, respectively. Lines represent model-predicted fungal loads over time. Sample sizes by species are provided in the electronic supplementary material, table S2A. (f) Fungal loads in early winter by sex for each host species. Larger circles outlined in black show estimated fungal loads on 1 November extracted from model predictions used in (a–e) to visualize the differences in early winter infections across species.

