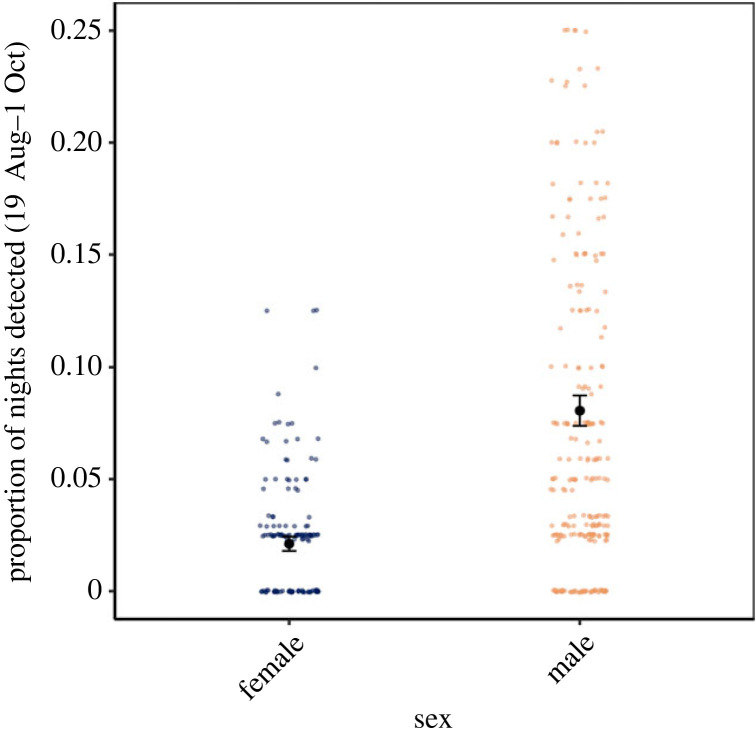
Figure 4.
Differences in autumn activity of female and male little brown bats at three hibernacula. Each data point represents the proportion of nights an individual bat was active at a site. The proportion of nights active was calculated as the number of nights an individual was detected at least once on the RFID systems divided by the total number of nights the RFID systems at each site were operating throughout autumn swarm. Points at 0 represent tagged bats that were never detected on a reader. Black points show model-predicted activity by sex with s.e. denoted with vertical bars. Sample sizes are provided in the electronic supplementary material, table S2D.

