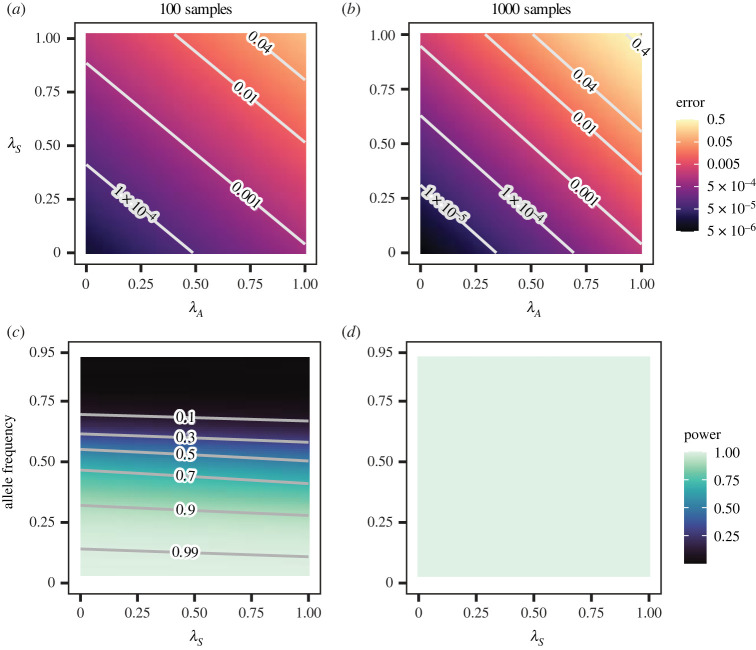
Figure 2.
(a,b) Type I error increased exponentially with population stratification in both sample sizes. (a) 100 samples. (b) 1000 samples. Each figure represents 3 200 000 SNPs pooled from 16 000 replicate simulations. (c,d) A large sample size eliminated Type II error. (c) 100 samples. (d) 1000 samples. Each figure represents the associated SNP from 16 000 replicates. Allele frequency was set to the mean value of 0.5 in (a) and (b). λS was set to the mean value of 0.04 in (c).

