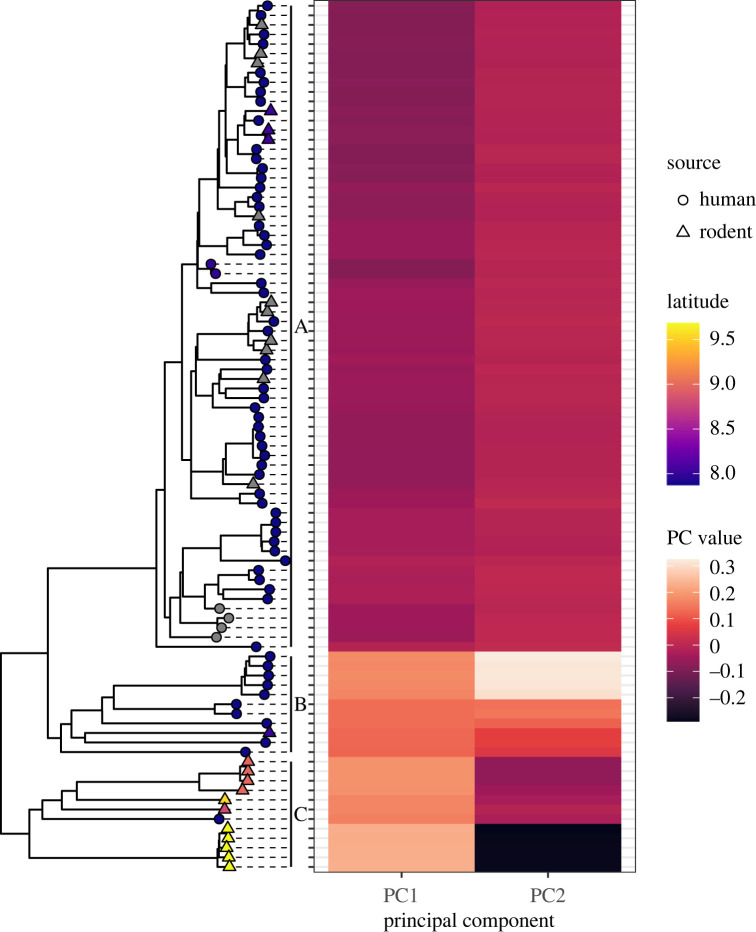
Figure 3.
Each tip on the LASV phylogeny was aligned to its PC values calculated by EIGENSTRAT. Three clusters of PC values were formed, each of which corresponded to a clade. Beginning from the top, Clade A had negative PC1 values and intermediate PC2 values; Clade B had positive values for PC1 and PC2; and Clade C had positive values for PC1 and negative values for PC2. Grey tips indicate that no location data were available.

