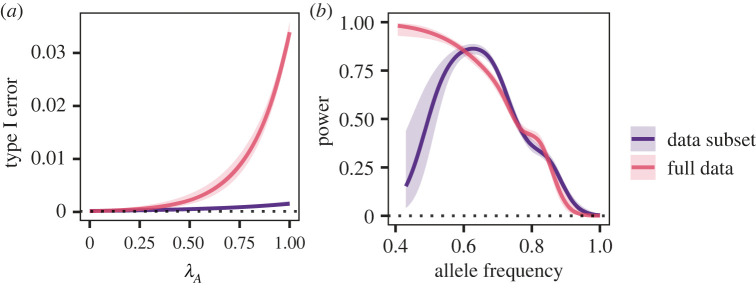
Figure 4.
GLM response curves showing (a) Type I error rate with and without Clade C. (b) The detection rate at ϕ = 0.75. The 95% confidence interval is indicated by the shaded area. The dotted line indicates the threshold used to assess GWAS significance, p < 0.0001. In (a), the GLM was conducted using the mean allele frequency of 0.4 and represents 60 000 replicates for each dataset. In (b), the GLM was conducted using the mean λA of 0.3 and represents 6000 replicates for each dataset.

