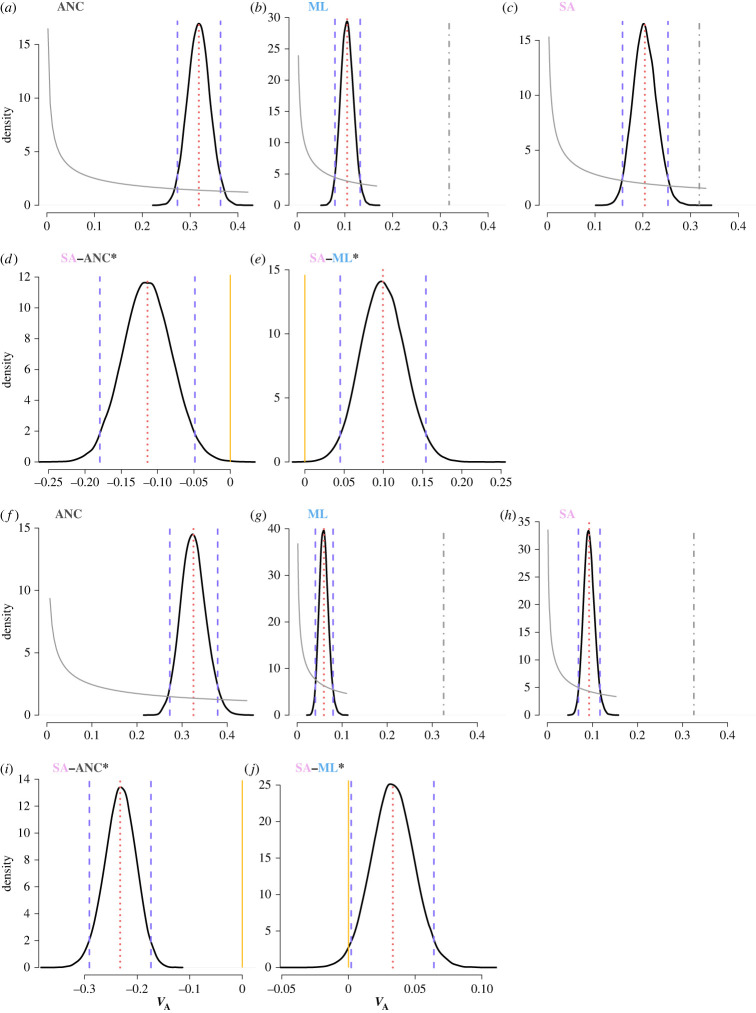
Figure 2.
More additive genetic variance (VA) is maintained under SA selection in (a–e) females and (f–j) males. Panels (a,f) show VA in the ancestral (ANC) population, while (b,g) show the evolved patterns after ten generations of artificial male-limited (ML) and (c,h) of sexually antagonistic (SA) selection. Panels (d,i) and (e,j) show the posterior difference between SA-ANC and SA-ML. Indicated are the marginal posterior distributions (solid black lines), 95% credible intervals (vertical dashed purple lines), posterior means (vertical dotted red lines) and prior distributions (solid grey lines). In panels (b,c) we additionally show the mean variance of the ancestral population (vertical dot-dashed grey line) to guide comparison. Asterisks indicate posterior difference distributions significantly greater than zero, i.e. where the 95% credible interval does not overlap 0 (highlighted with a vertical yellow line). Note the different scales on the x-axis and y-axis between different plots.

