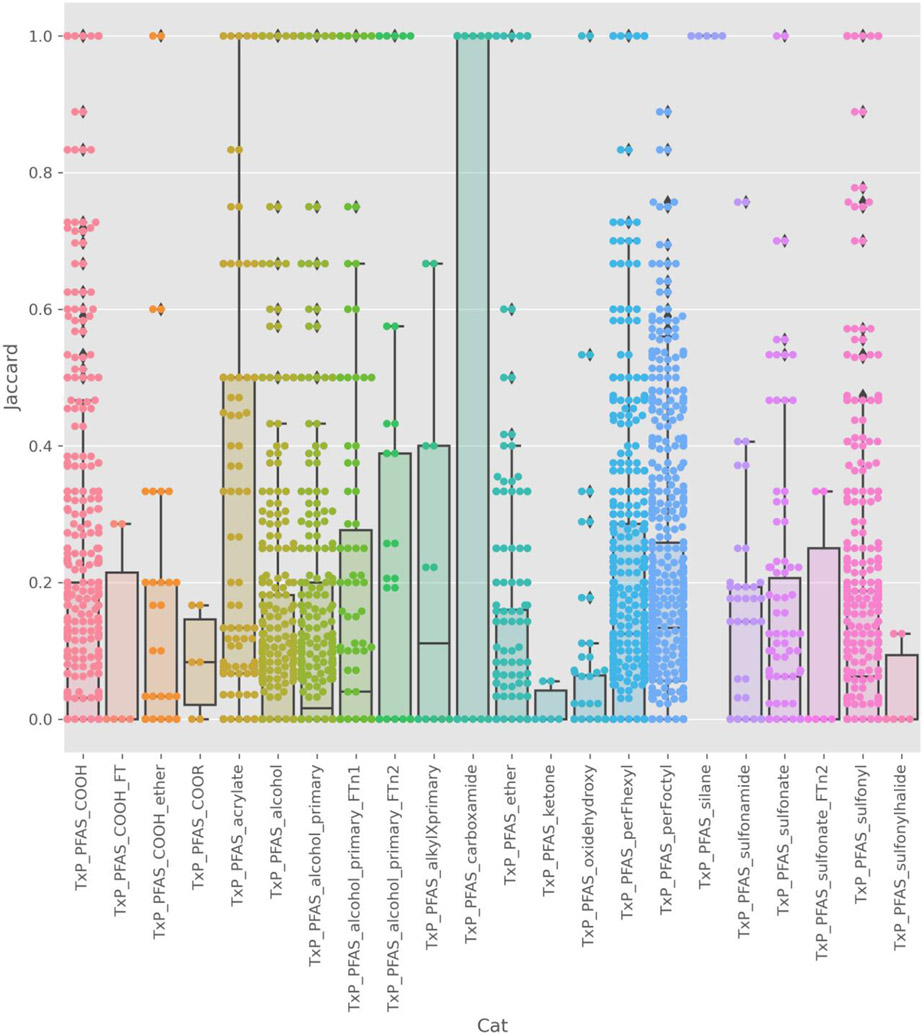
Figure 12.
Jaccard pairwise similarity on hitcall data for the 115 substances tested. Boxplot (to show the distribution of Jaccard similarities) and swarmplot (showing each pairwise similarity) that is overlaid shows the distribution of the chemical pairwise Jaccard similarity indices within a TxP_PFAS_34cat category where the hitcall profile across all ATG assays is used to characterise a given chemical. Within a category, the frequency of pairs of chemicals sharing very similar (Jaccard = 1) or different (Jaccard = 0) activity profile are shown.

