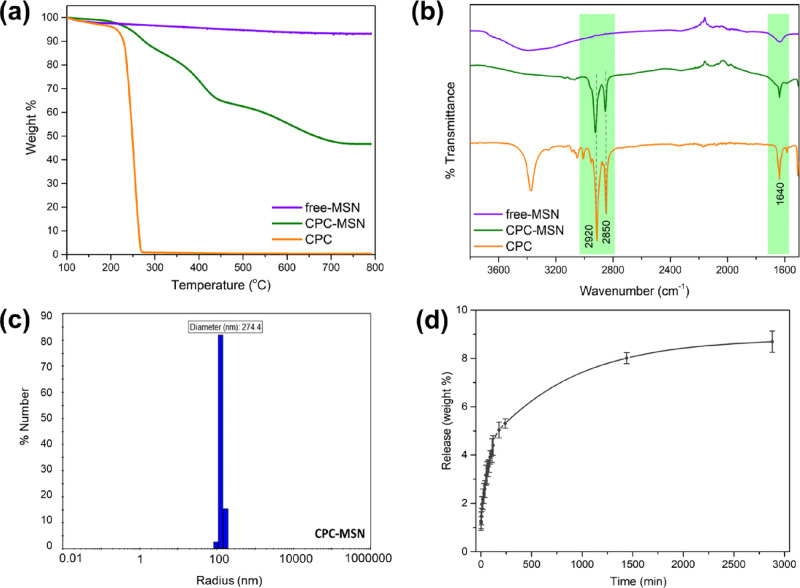
Figure 3.
(a) Thermogravimetric analysis (TGA) curves of CPC-MSN, free-MSN, and pristine CPC. (b) Stacked infrared (IR) spectra of CPC-MSN, free-MSN, and pristine CPC. (c) Dynamic light scattering (DLS) measurement of CPC-MSN in aqueous medium. (d) Release profile of CPC from CPC-MSN in aqueous medium.

