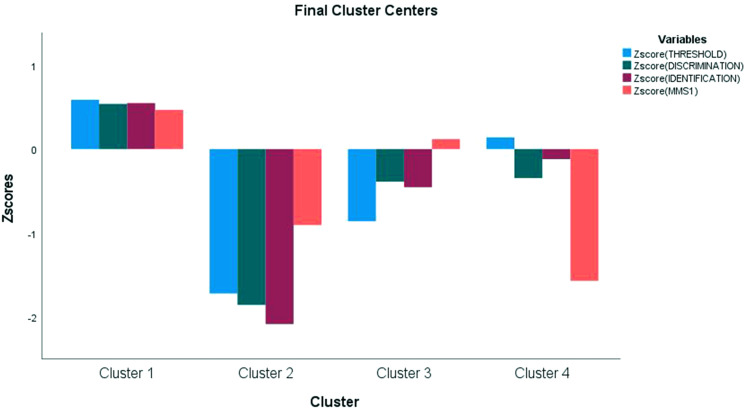
Figure 2.
Z scores to standardize variables of T, D, I, and MMSE demonstrate the contribution of each variable to cluster composition. For example, cluster 1 is driven by higher scores in all variables, while cluster 2 is driven by lower scores in all variables. Cluster 3 is driven by lower T scores with increased MMSE, while cluster 4 is driven by lower MMSE.
Abbreviations: T, threshold; D, discrimination; I, identification; MMSE, Mini-Mental Status Examination.

