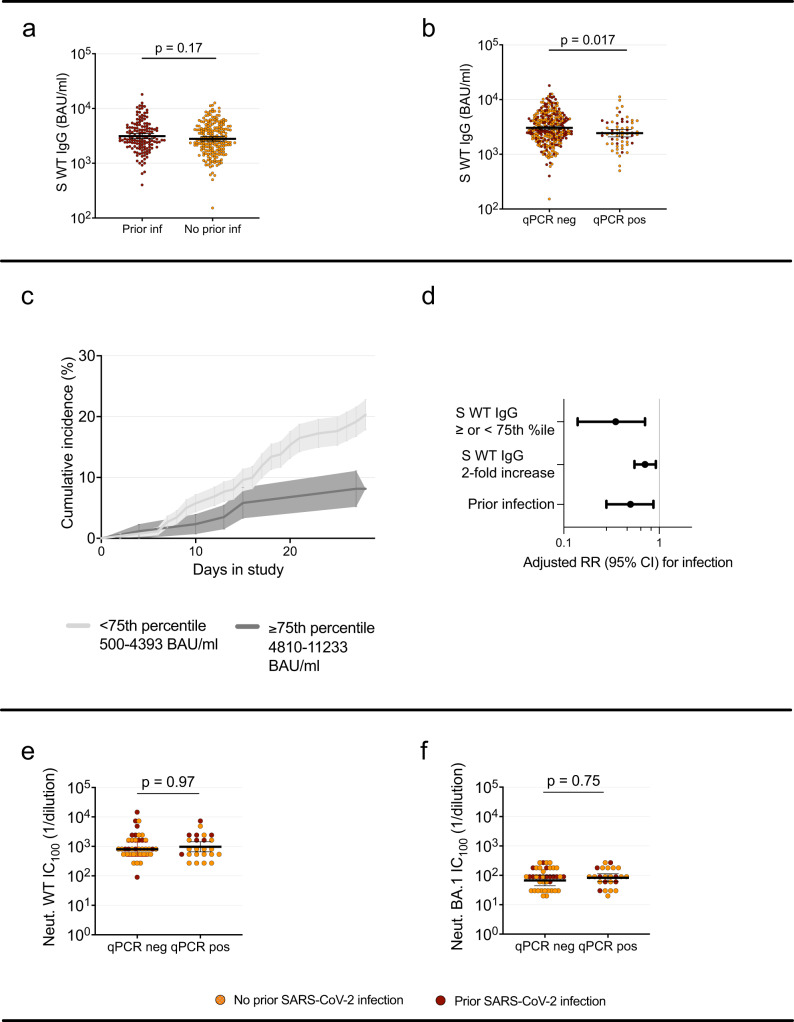
Fig. 3. Effect of antibody levels and prior infection status on risk of infection, and pre-infection antibody titers in participants who subsequently tested qPCR positive or not.
a WT spike-specific serum-IgG at baseline in participants with (n = 144) and without (n = 203) prior SARS-CoV-2 infection. b WT spike-specific serum IgG at baseline in participants that remained qPCR negative (n = 287) and participants that tested qPCR positive (n = 60) during the screening period. c Cumulative incidence over the study period in participants with spike-specific serum IgG levels above/at (n = 87) or below (n = 260) 75th percentile. Shaded areas depict Standard Error. d Adjusted relative risk of infection among participants above (n = 87) vs below (n = 260) 75th percentile, per two-fold increase in WT spike-specific serum-IgG level and among those with and without prior infection. Estimates derived from a Poisson regression model and error bars depict 95% confidence interval. e Microneutralization titers against SARS-CoV-2 WT and (f) omicron BA.1 in participants that remained qPCR negative (n = 40) and participants that tested qPCR positive (n = 24) during the screening period. In (a), (b), (e) and (f), Mann-Whitney U test with a two-tailed p-value was performed without adjustment for multiple comparisons. Lines depict geometric mean titer and bars depict 95% confidence interval. S spike, WT Wild type, RR relative risk, CI confidence interval, Ct cyclic threshold, qPCR qualitative polymerase chain reaction, pos positive, neg negative, BAU binding antibody units, Neut microneutralizing titer, ns; p > 0.05. Source data are provided as a Source Data file.

