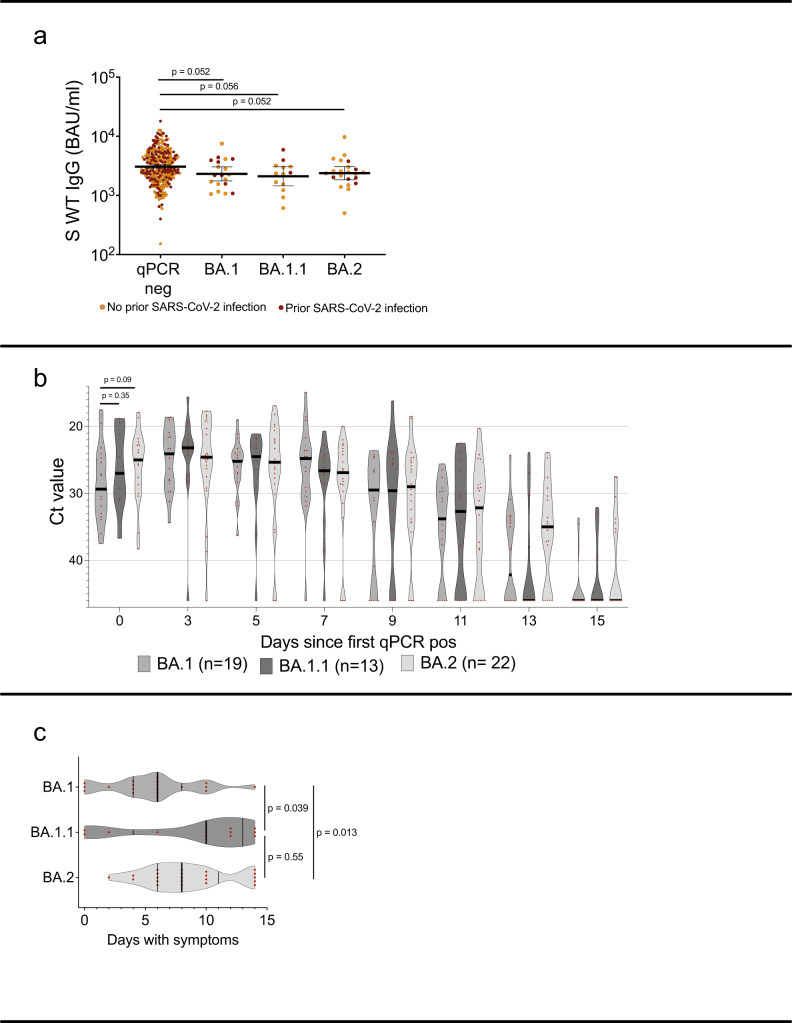
Fig. 4. Post booster WT spike-specific IgG levels with comparisons between subsequent omicron sublineage breakthrough infections.
a Post booster WT spike-specific IgG titers in participants that remained qPCR negative (n = 287) and in participants who tested positive with BA.1 (n = 19), BA1.1 (n = 13) or BA.2 (n = 22) infection during the screening period. b Ct values in qPCR positive participants the first 15 days of breakthrough infection with BA.1, BA.1.1 and BA.2. c Number of symptomatic days for participants who tested positive with BA.1, BA1.1 or BA.2 infection during the screening period. In (a), lines depict geometric mean titer and bars depict 95% confidence interval. In (b) and (c) lines depict median with IQR. Mann-Whitney U test with a two-tailed p-value was performed without adjustment for multiple comparisons. Pos Positive, Neg negative, S spike, WT wild-type, Ct cyclic threshold, BAU binding antibody units, ns; p > 0.05. Source data are provided as a Source Data file.

