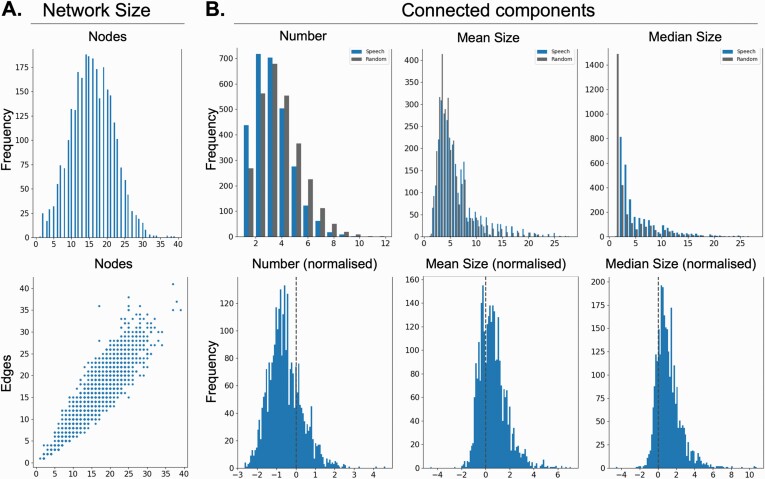
Fig. 3.
General public networks. Semantic speech networks differ in their properties from random networks. (A) Histogram for number of nodes and scatter plot showing the relationship between number of nodes and number of edges of semantic speech networks from the general public. Each datapoint in the scatter plot represents one subject. Values were obtained by averaging across network measures from the eight TAT picture descriptions. (B) Top row shows number, mean size, and median size of the connected components in the speech graphs (blue bars) and a randomly chosen subset of the size-matched random graphs (gray bars). Bottom row shows normalized number, mean size, and median size of the connected components in speech graphs.

