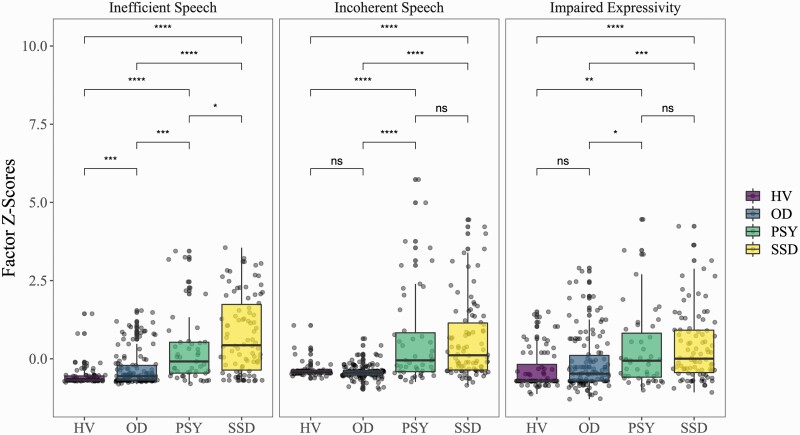
Fig. 1.
Group Differences In Factor Scores: Pair-wise comparisons made using t-tests. Significance levels shown on the graph are uncorrected values. Results are largely consistent after correcting for multiple comparisons with the FDR method, the pair-wise P values are as follows. Inefficient speech: HV*OD = 0.05; PSY*SSD = 0.003; all others P < .001. Incoherent speech: HV*OD & PSY*SSD NS; all others P < .001. Impaired Expressivity: HV*OD & PSY*SSD NS; HV*OD, HV*SSD, and OD*SSD P < .001; OD*PSY = 0.01. NS, Not significant; * P < .05; ** P < .01; ***P <.001. HV, healthy volunteers; OD, other psychiatric disorders; PSY, other or undetermined psychotic disorders; SSD, schizophrenia spectrum disorders.

