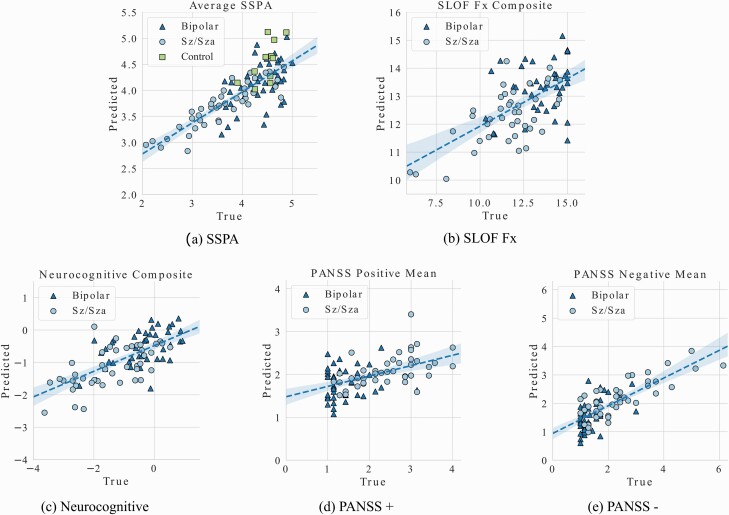
Fig. 3.
Visual representations of the regression prediction results for the (a) Average SSPA score, (b) SLOF Fx, (c) neurocognitive composite score, (d) PANSS positive symptoms average, and (e) PANSS negative symptoms average. Detailed statistics can be found in Table 3.

