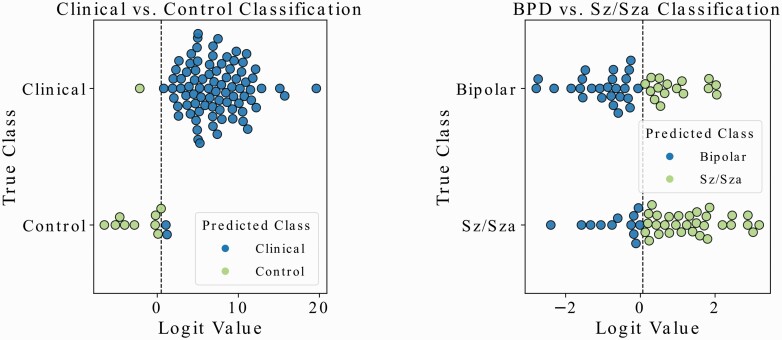
Fig. 4.
Visual representation of the two classification prediction experiments conducted in this study. The first plot shows the out-of-sample test set results for the clinical vs healthy control classification, and the second plot shows the same for the BPD vs Sz/Sza classification. Associated statistics are reported in Table 4.

