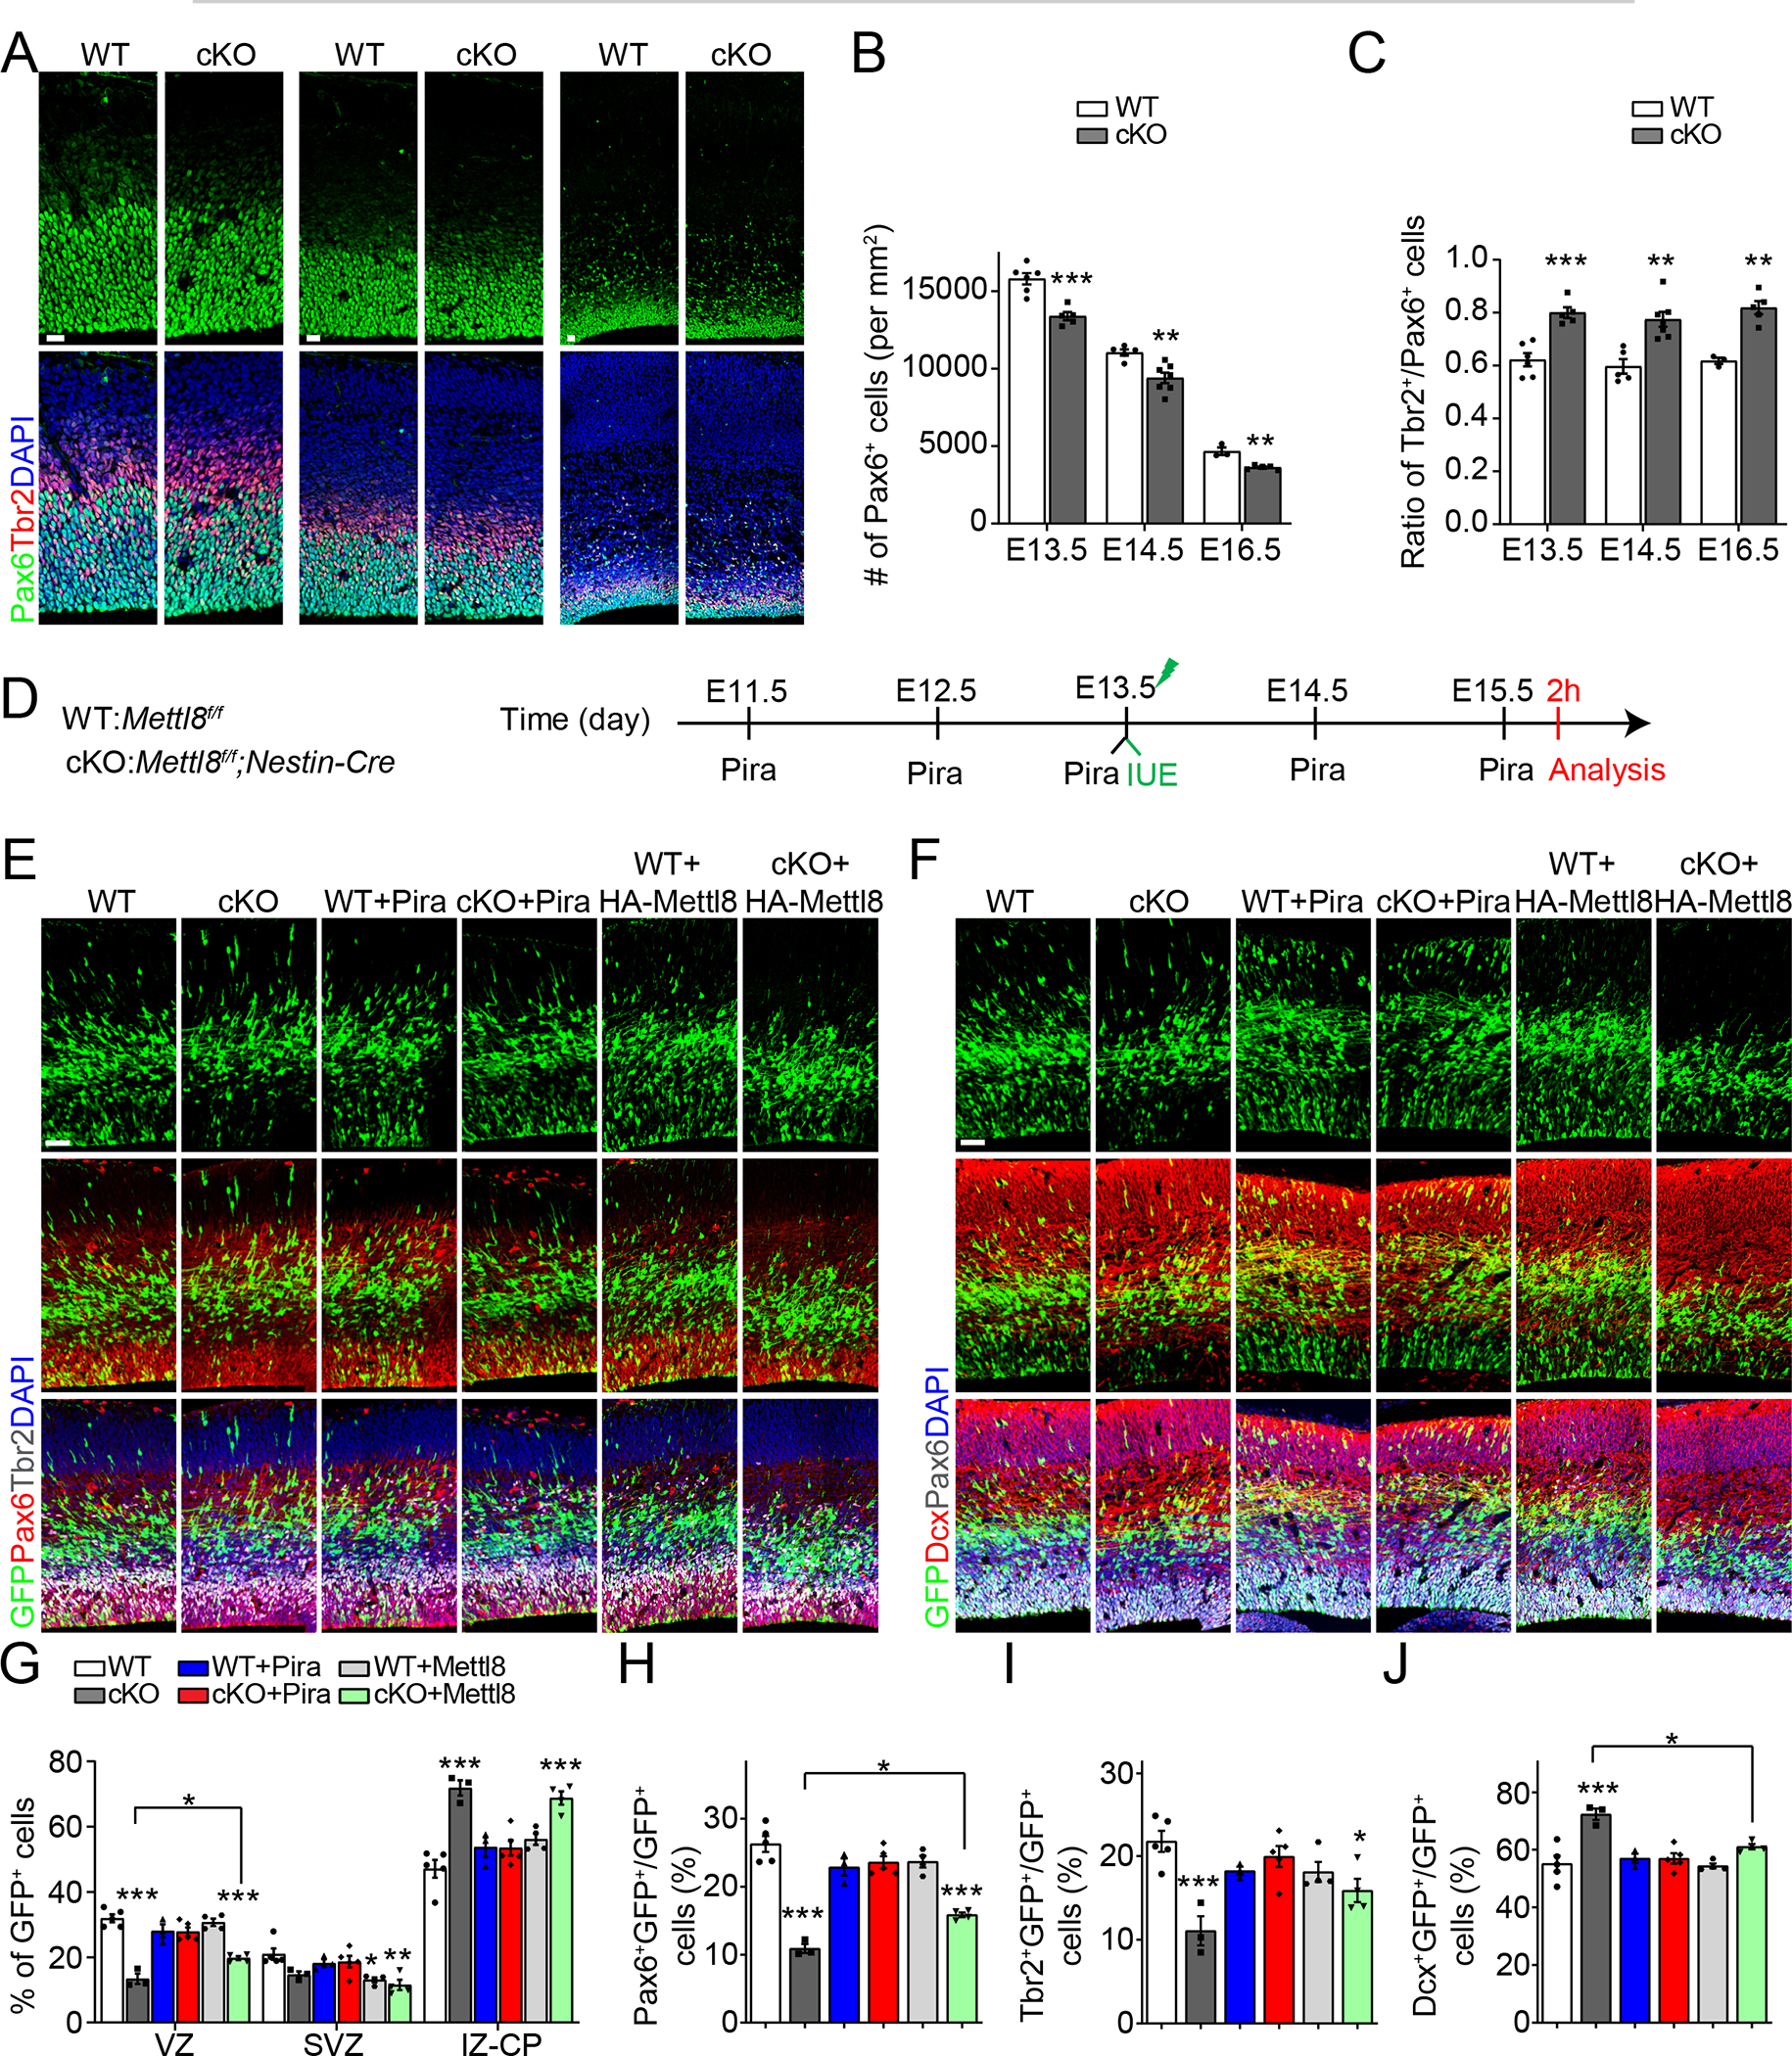
Figure 3. Mettl8 deletion leads to deficits in neural stem cell maintenance in vivo.

(A-C) Sample immunostaining confocal images (A; Scale bars: 20 μm) and quantification of the density of Pax6+ neural stem cells (B) and the ratio of Tbr2+ cells over Pax6+ cells (C) in WT and cKO cortex. Values represent mean ± SEM (E13.5: n = 6/WT, 5/cKO; E14.5: n = 5/WT, 7/cKO; E16.5: n = 3/WT, 5/cKO; *P < 0.05, **P < 0.01, ***P < 0.001; Student’s t-test).
(D-J) Mettl8 cKO mice exhibit deficits in neural stem cell maintenance with increased neuronal differentiation, which were rescued by piracetam treatment (500 mg/kg body weight). Shown are schematic diagram of experimental design (D), sample immunostaining confocal images (E, F; Scale bars: 50 μm) and quantifications for percentages of GFP+ cells distributed across different layers of the cortex (G) and percentages of different cell types among all GFP+ cells (H-J) in WT and cKO mice. Values represent mean ± SEM (n = 5/WT, 3/cKO, 3/WT+Pira, 5/cKO+Pira, 4/WT+Mettl8, 4/cKO+Mettl8; *P < 0.05, ***P < 0.001; One-way ANOVA).
See also Figure S3
