
Extended Data Fig. 6. Endosomal Gαs regulates nuclear ERK activity and function.
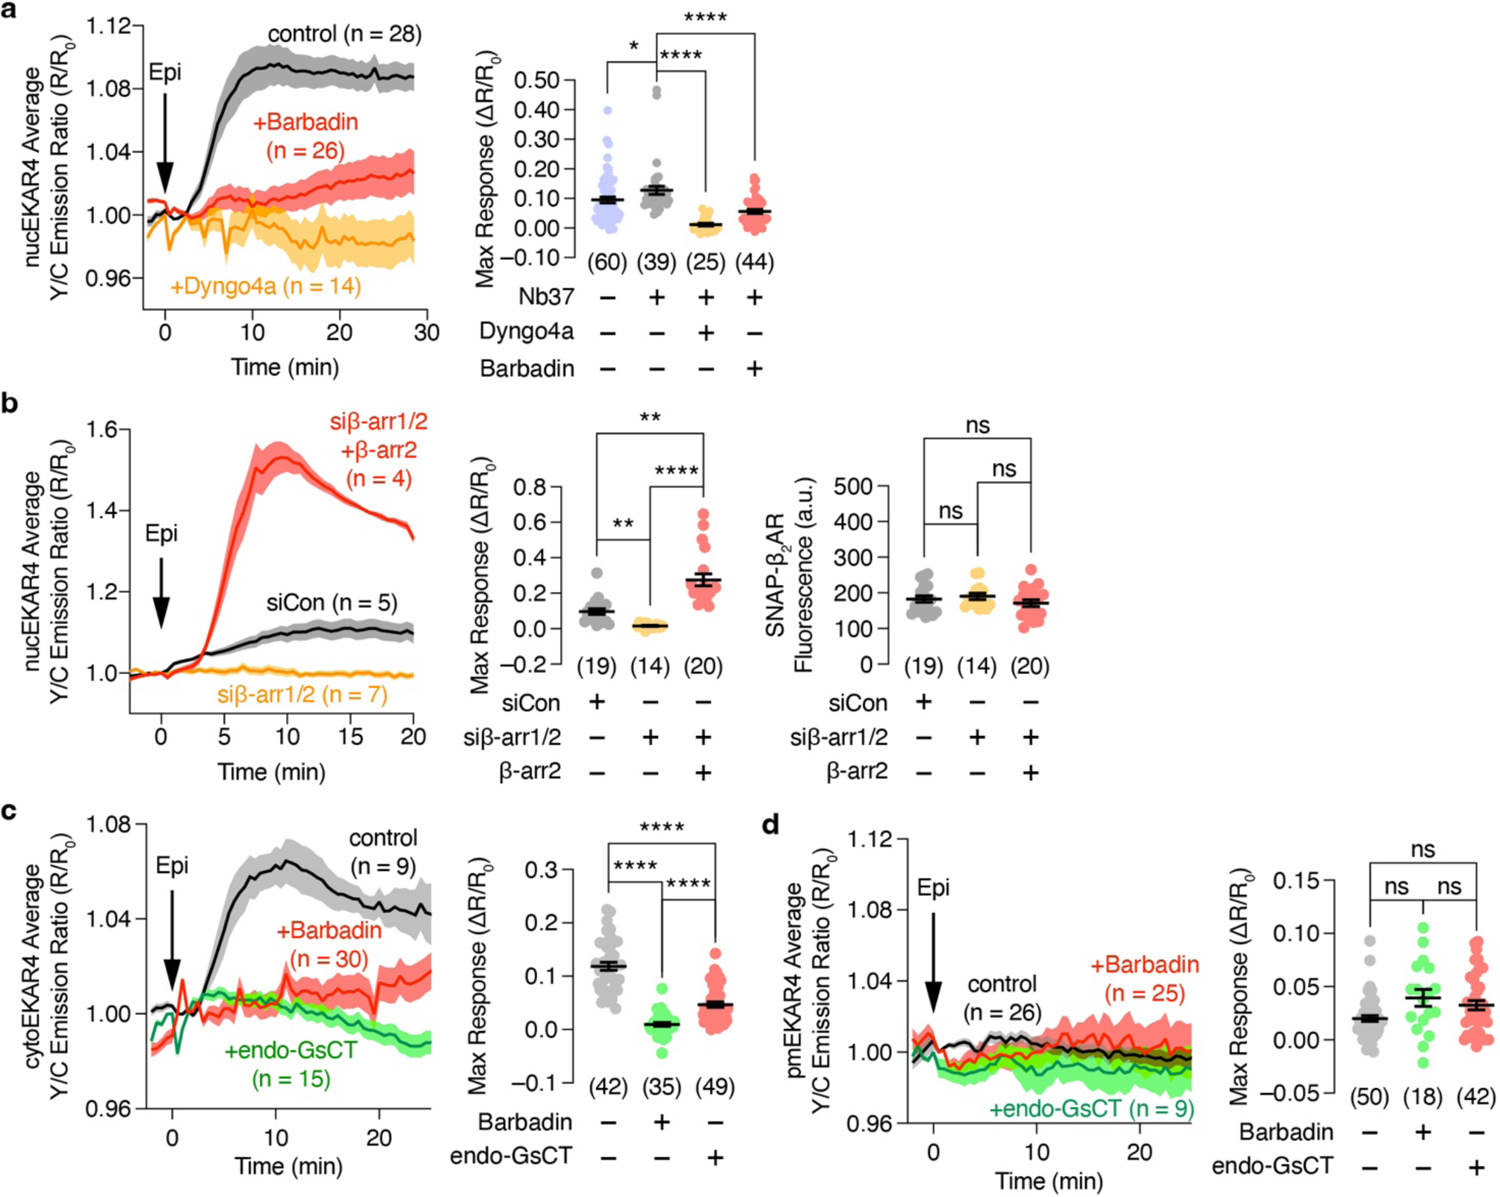
(a, b) Left: Representative 10 μM epinephrine (Epi)-stimulated yellow/cyan (Y/C) emission ratio changes from HEK293T cells co-expressing nucEKAR4, SNAP-β2AR and (a) Nb37 in the presence or absence of 100 μM barbadin or 5 μM of Dyngo4a preincubation or (b) additionally transfected with control siRNA or siRNA targeting β-arr1 and 2 plus vector or β-arr2. (a) Right, (b) middle: Maximum nucEKAR4 responses under the indicated conditions. (b) Right: SNAP-β2AR fluorescence intensity under the indicated conditions. (c and d) Left: Representative time courses showing the 10 μM Epi-stimulated yellow/cyan (Y/C) emission ratio changes of (c) cytoEKAR4 or (d) pmEKAR4 in HEK293T cells co-expressing SNAP-β2AR with or without endoGsCT or preincubation with 100 μM barbadin. Right: Maximum EKAR4 responses. ns, not significant, *P < 0.05, **P < 0.01, ***P < 0.001, ****P < 0.0001; Kruskal-Wallis test followed by Dunn’s multiple-comparison test (a, b middle), ordinary one-way ANOVA followed by Holm-Šidák’s multiple-comparison test (b right), Welch ANOVA followed by Dunnett’s T3 multiple-comparison test (c, d). Solid lines in time courses indicate the mean, and shaded areas show SEM. Lines in scatter plots represent mean ± SEM. Negative control curve and data points in (c and d) are reproduced from Fig. 1a and c, respectively.