
Extended Data Fig. 7. Endogenous β-adrenergic-stimulated ERK activation.
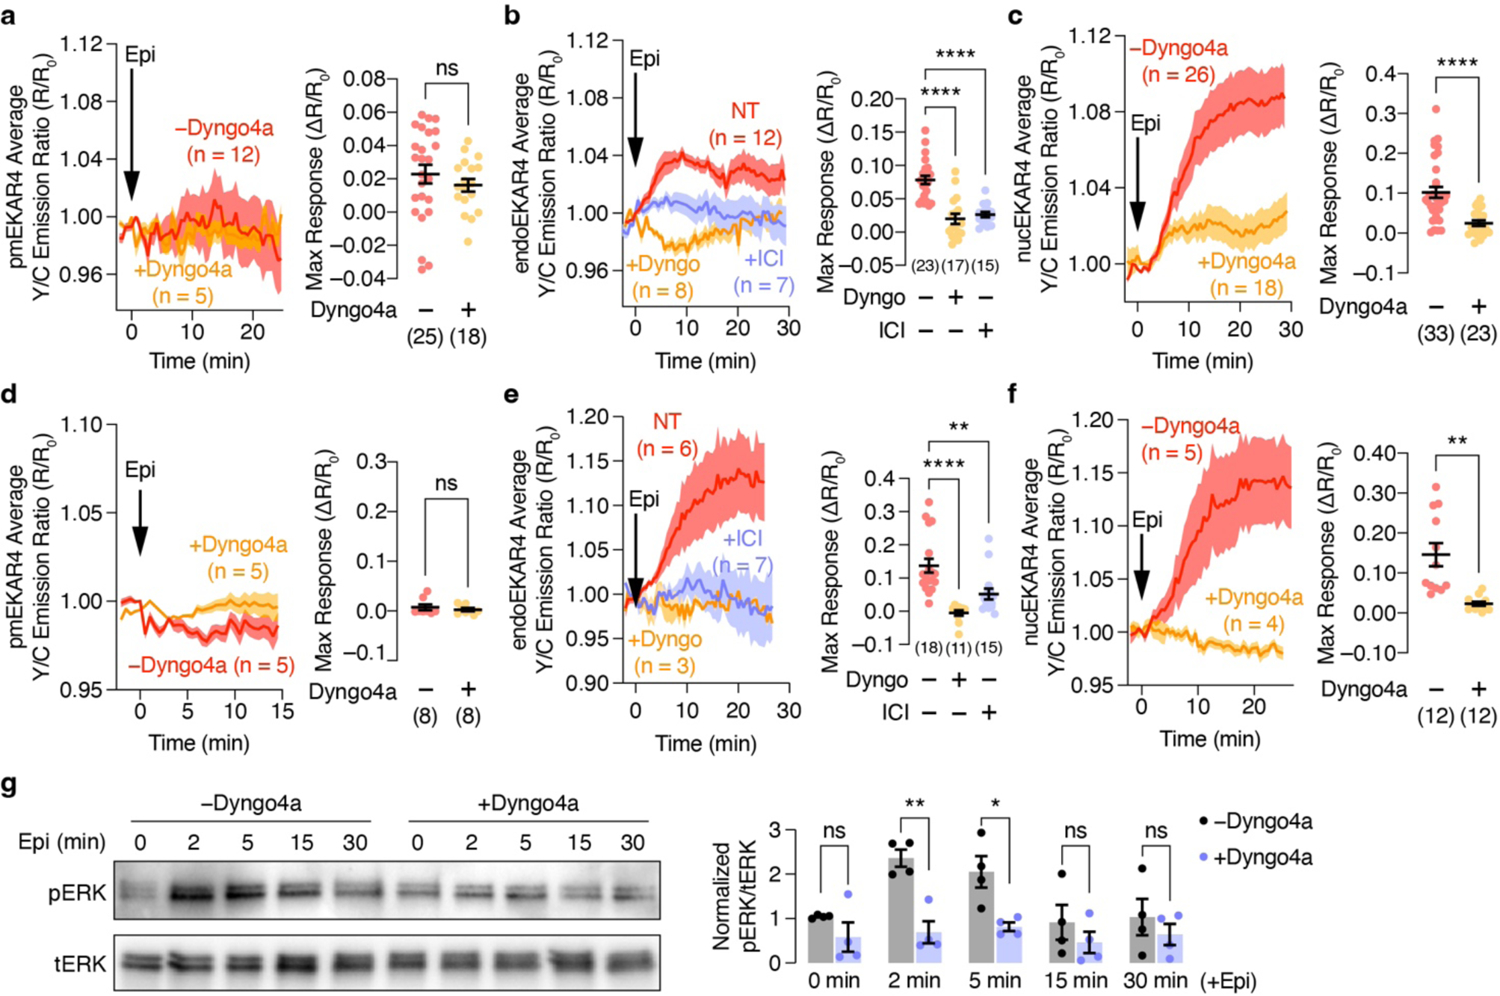
Left: Representative 10 μM epinephrine (Epi)-stimulated yellow/cyan (Y/C) emission ratio changes from (a-c) HEK293T cells or (d-f) H9c2 cells expressing (a, d) pmEKAR4, (b, e) endoEKAR4, or (c, f) nucEKAR4 with or without 5 μM Dyngo4a (b, e) with ICI-118,551 preincubation. Right: Maximum EKAR4 responses under the indicated conditions. Solid lines in time courses indicate the mean, and shaded areas show SEM. Lines in scatter plots represent mean ± SEM. (g) Western blot analysis of phospho-ERK (pERK) and total ERK (tERK) levels in HEK293T cells stimulated with Epi for 0, 2, 5, 15, and 30 min with or without Dyngo4a preincubation. Representative blot (left) and quantification of normalized pERK/tERK levels at each time point (right). Full blots are shown in Supplementary Fig. 1. ns, not significant, **P < 0.01, ***P < 0.001, ****P < 0.0001; Mann-Whitney U-test (a) or unpaired two-tailed Student’s t-test without (c, d) or with (f,g) Welch’s correction, or ordinary one-way ANOVA followed by Holm-Šídák’s multiple-comparison test (b, e).