
Extended Data Fig. 8. Compartmentalized ERK activation by the stimulation of multiple types of GPCRs.
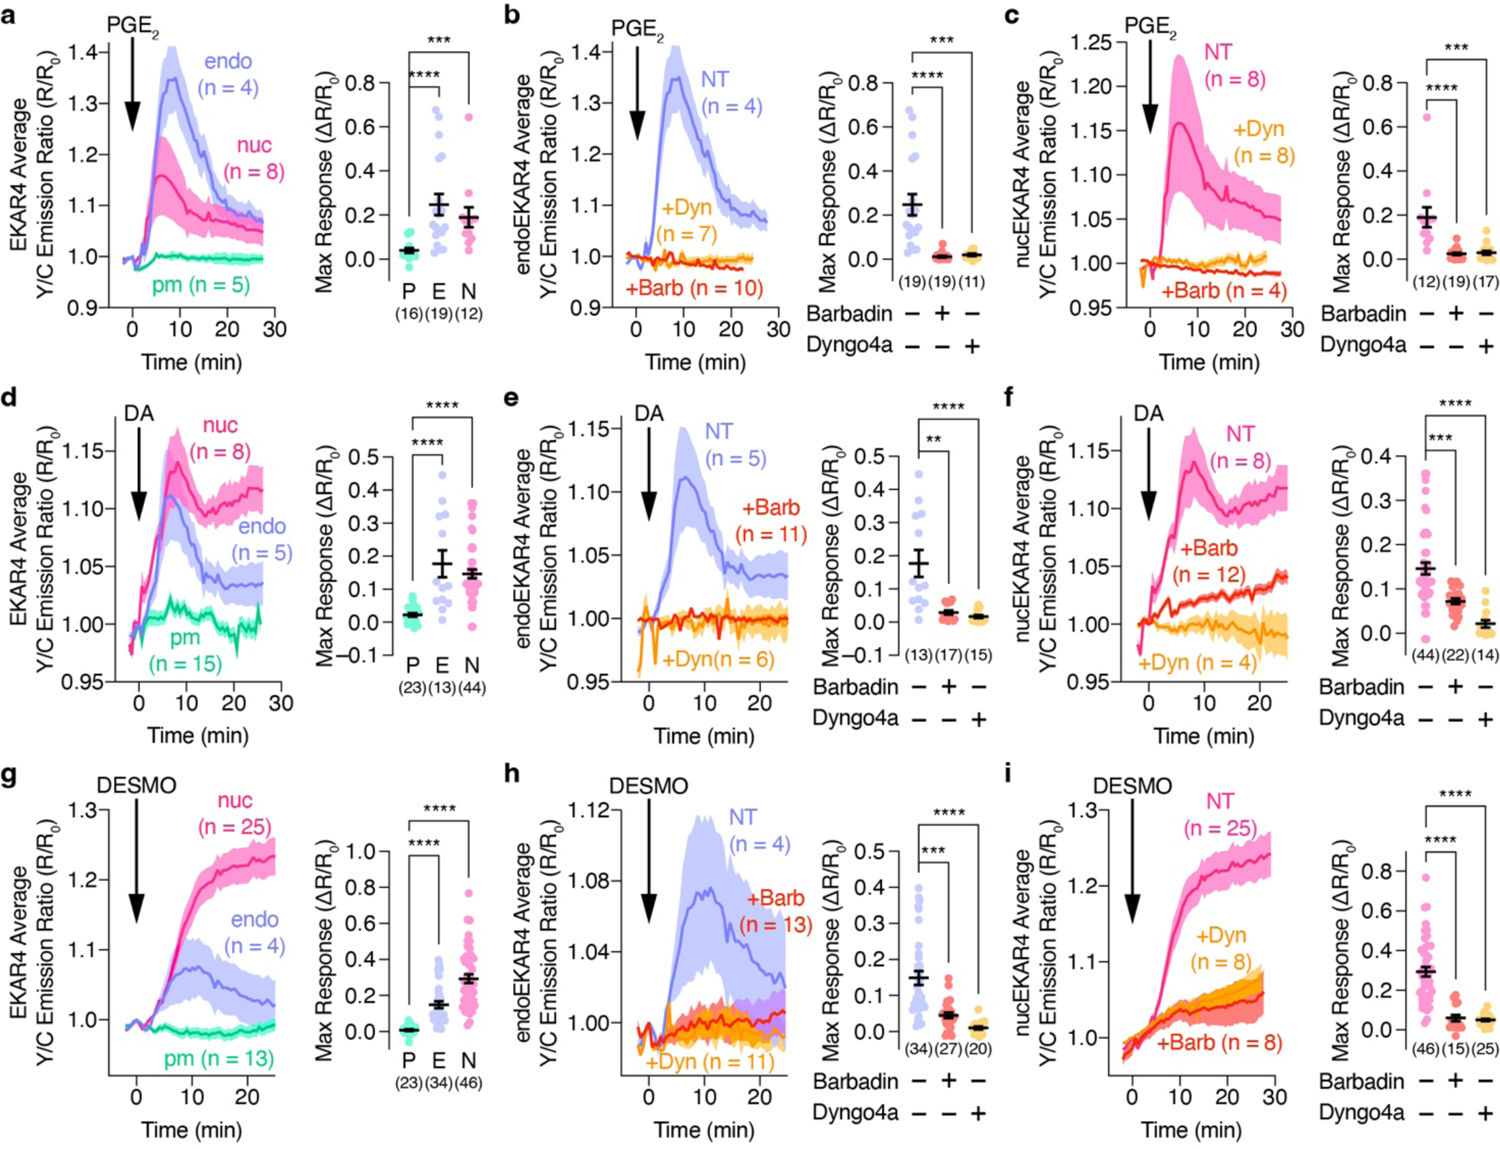
Left: Representative yellow/cyan (Y/C) emission ratio changes of HEK293T cells co-expressing (a-c) EP4, (d-f) D1DR, or (g-i) V2R plus (a, d, g) diffusible, (b, e, h) endo- or (c, f, i) nucEKAR4 upon stimulation with 10 μM (a-c) PGE2, (d-f) 100 μM DA or (g-i) 100 nM DESMO with or without preincubation with 5 μM Dyngo4a or 100 μM barbadin. Right: Maximum EKAR4 responses under the indicated conditions. **P < 0.01, ***P < 0.001, ****P < 0.0001; Kruskal-Wallis test followed by Dunn’s multiple-comparison test. Solid lines in time courses indicate the mean, and shaded areas show SEM. Lines in scatter plots represent mean ± SEM.