
Extended Data Fig. 9. Growth factor-induced ERK target gene expression.
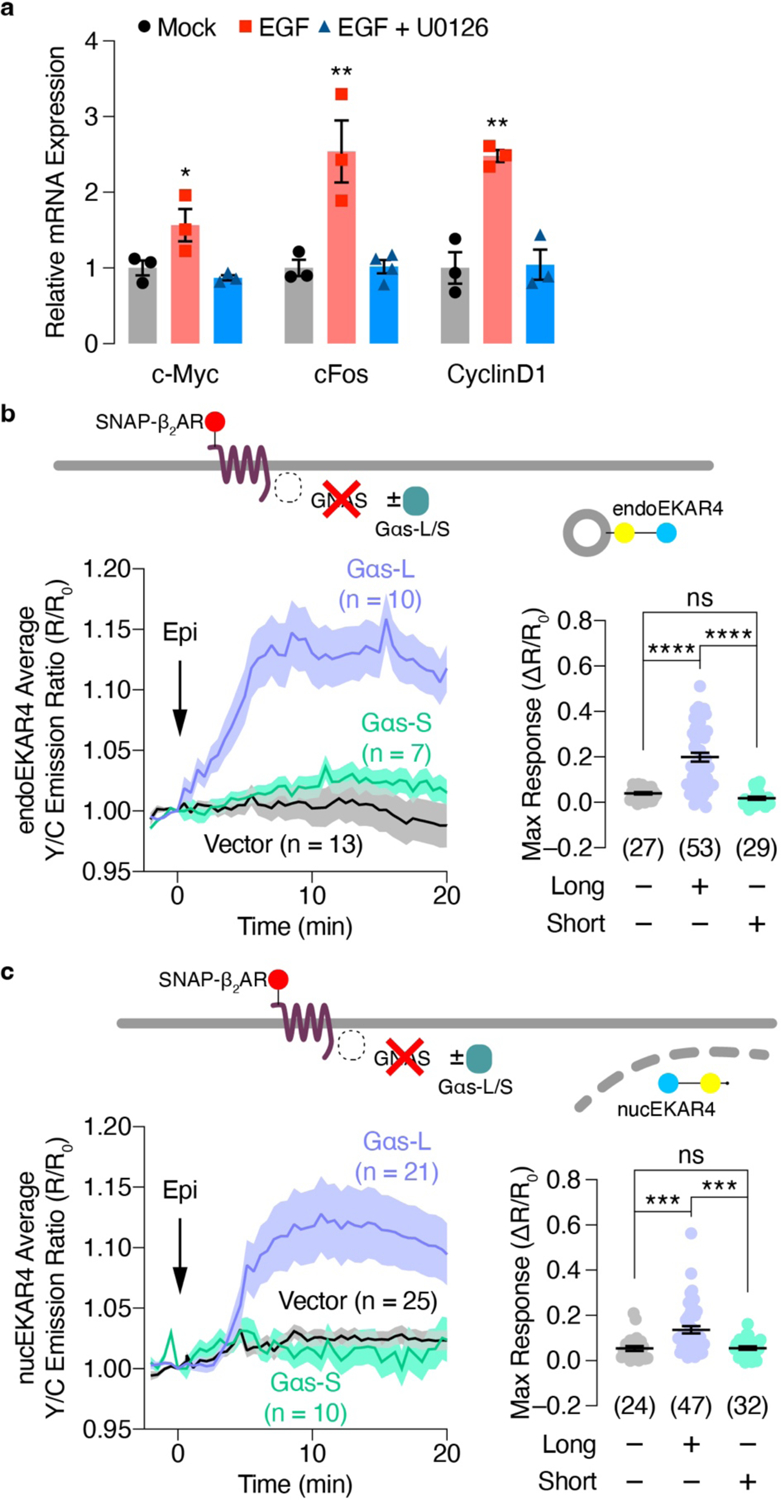
(a) qPCR analysis of c-Myc, c-fos and cyclin D1 mRNA in EGF-treated HEK293T cells with or without U0126 preincubation. (n = 3 independent experiments). *P < 0.05, **P < 0.01, ****P < 0.0001 vs. Mock or EGF + U0126; ordinary one-way ANOVA followed by Tukey’s multiple-comparison test. (b, c) Left: Representative yellow/cyan (Y/C) emission ratio traces from GNAS KO HEK293 cells co-expressing (b) endo or (c) nucEKAR4 and additionally expressing vector, Gαs-L or Gαs-S with or without 10 μM epinephrine (Epi) stimulation. Right: Maximum EKAR4 responses. ns, not significant, ***P < 0.001, ****P < 0.0001; Kruskal-Wallis test followed by Dunn’s multiple-comparison test (b, c). Solid lines in b and c indicate the mean, and shaded areas show SEM. Horizonal lines in b and c depict the mean ± SEM. Negative control and Gαs-L curves and data points in (b) are reproduced from Fig. 2c.