
Extended Data Fig. 4. Localization of endosome-targeted nanobodies and GsCT and the effect on ERK.
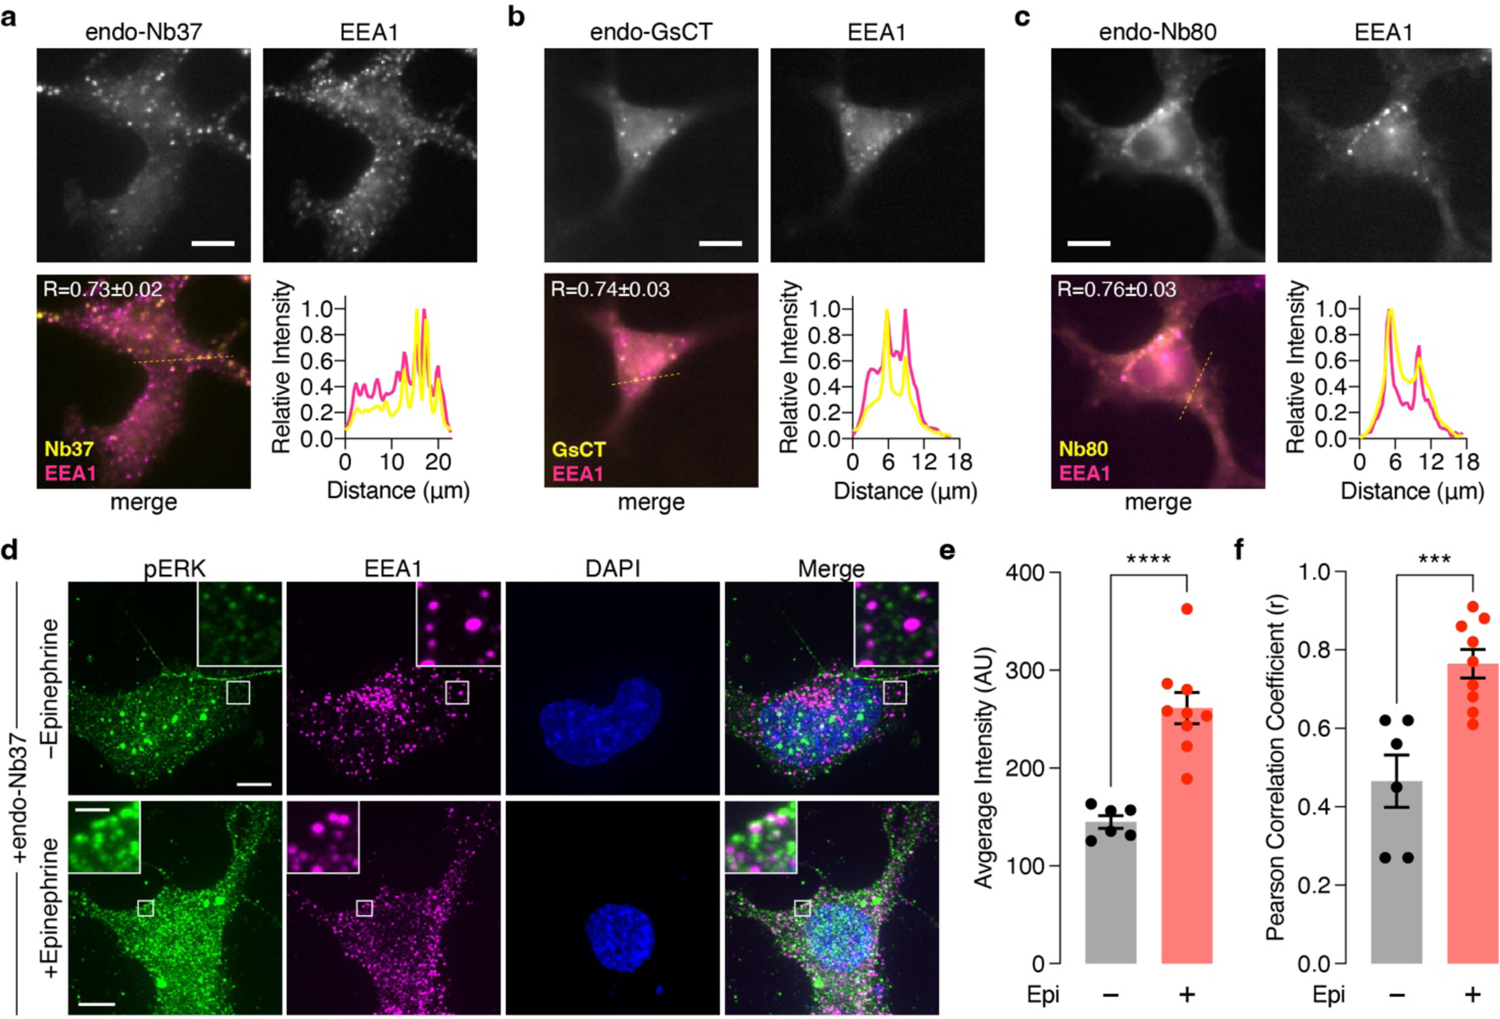
(a-c) Epifluorescence microscopy analysis of (a) endo-Nb37, (b) endo-GsCT, and (c) endo-Nb80 colocalization with the endosomal marker EEA1 in HEK293T cells. Individual channel images of (upper left) mCherry fluorescence from endo-Nb37, endo-GsCT, and endo-Nb80 and (upper right) Alexa Fluor 647 fluorescence (goat anti-rabbit Alexa Fluor 647 × rabbit anti-EEA1), as well as (lower left) merged channels are shown. Line intensity profile plots corresponding to the dashed yellow lines on the merge images are shown to the lower right. (d) Maximum-intensity-projected super-resolution fluorescence images of HEK293T cells co-expressing SNAP-β2AR plus endo-Nb37 with (lower) or without (upper) epinephrine stimulation and stained for phospho-ERK (pERK; goat anti-mouse Atto488 × mouse anti-pERK), EEA1 (endosomes; goat anti-rabbit Alexa Fluor 647 × rabbit anti-EEA1), and DAPI (nuclei). (e, f) Histograms showing (e) the total intensity from the 488 nm (pERK) channel and (f) the Pearson correlation coefficient for EEA1 and pERK colocalization in HEK293T cells co-expressing SNAP-β2AR plus endo-Nb37 with (+) or without (−) epinephrine (Epi) stimulation (n = 6 and 9 for − and + Epi, respectively). Scale bars, 10 μm. ***P < 0.001, ****P < 0.0001; unpaired two-tailed Student’s t-test. Lines in scatter plots represent mean ± SEM.