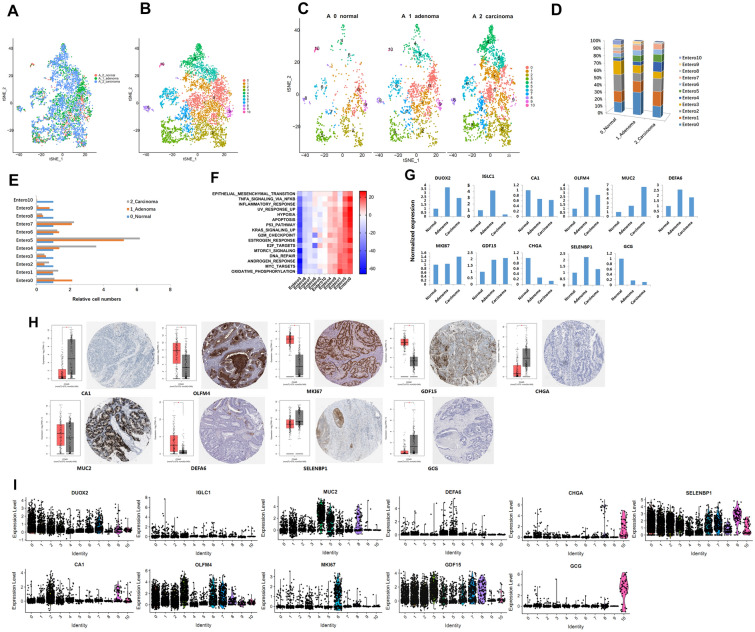
Fig. 4.
Identification of enterocyte cell clusters and their expression features. A. tSNE plot of all the enterocyte, colored by different stages. B. tSNE plot of all the enterocyte, colored by clusters. C. tSNE plot of all the enterocyte, colored by different stages and clusters. D. The stacked histogram shows the 11 different cell cluster composition in 3 pathological stages. E. The bar chart shows each enterocyte cell cluster composition of 3 pathological stages. F. The expression of marker genes of the enterocyte cells in different stages. G. Expression-based pathway activities scored by GSVA per enterocyte cluster, the red color indicates enrichment and blue color indicates not enrichment. H. The top marker gene expression and cell location of enterocyte clusters by TCGA and the Human Protein Atlas. I. Violin plots of top marker gene expression in enterocyte clusters

