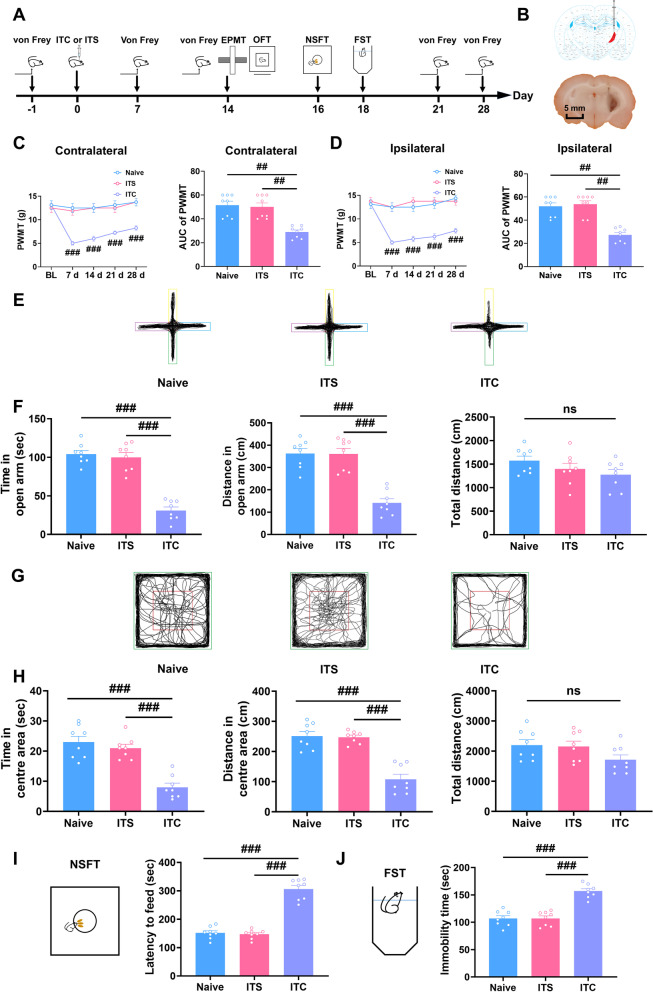
Fig. 1.
ITC rats exhibited mechanical allodynia and anxiodepressive-like behaviors. A Experimental timeline for surgical procedure and behavior tests. B Schematic diagram showing the injection site of ITC (top) and representative photomicrograph of brain slice showing the hemorrhagic lesion location following ITC (bottom). Scale bar = 1 mm. C The PWMT of the contralateral hindpaw was significantly decreased 7 days after ITC and persisted throughout the testing period, as did the area under curve of the contralateral hindpaw PWMT (n = 8, PWMT: group, F2, 21 = 15.53, day, F4, 84 = 25.63, group × day, F8, 84 = 16.45, ###p < 0.001 vs Naive; AUC: F2, 21 = 27.71, ##p < 0.01). D The PWMT of the ipsilateral hindpaw was significantly decreased 7 days after ITC and persisted throughout the testing period, as did the area under curve of the ipsilateral hindpaw PWMT (n = 8, PWMT: group, F2, 21 = 22.95, day, F4, 84 = 29.24, group × day, F4, 84 = 19.49, ###p < 0.001 vs Naive; AUC: F2, 21 = 19.18, ##p < 0.01). E Representative track plot in the EPMT. F ITC decreased the time spent and traveled distance in the open arms, but had no effect on the total traveled distance in EPMT (n = 8, time in open arm: F2, 21 = 61.14, ###p < 0.001; distance in open arm: F2, 21 = 32.31, ###p < 0.001; total distance: ns, no significance). G Representative track plot in the OFT. H ITC decreased the time spent and traveled distance in central area, but had no effect on the total traveled distance in the OFT (n = 8, time in central area: F2, 21 = 28.00, ###p < 0.001; distance in central area: F2, 21 = 35.95, ###p < 0.001; total distance: ns, no significance). I ITC increased the latency to feed in the NSFT (n = 8, F2, 21 = 38.23, ###p < 0.001). J ITC increased the immobility time in the FST (n = 8, F2, 21 = 97.32, ###p < 0.001). Data are expressed as mean ± SEM, one-way ANOVA followed by the Tukey test

