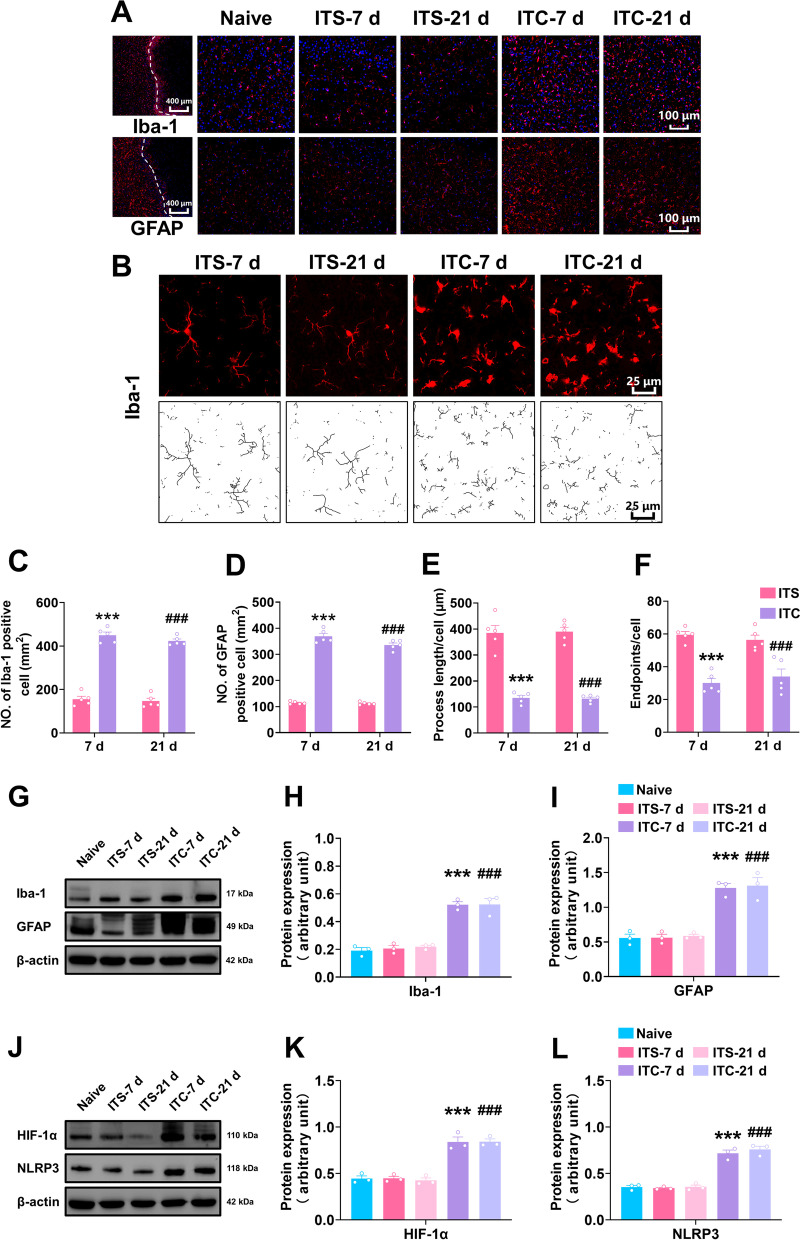
Fig. 2.
ITC activated microglia and astrocytes and upregulated HIF-1α and NLRP3 in the peri-thalamic lesion sites of rats. A Representative immunofluorescence images showing the time course expressions of GFAP and Iba-1, in the peri-thalamic lesion sites. Scale bar = 100 μm. B Representative magnified images of microglia (top) and the corresponding black-and-white, skeletonized images (bottom) in the peri-thalamic lesion sites. Scale bar = 25 μm. C, D Quantification of cell number showed ITC increased Iba-1 (C) and GFAP (D) positive cells in in the peri-thalamic lesion sites at 7 and 21 d n = 5, Iba-1: F3, 16 = 167.2, ***p < 0.001 vs ITS-7 d, ###p < 0.001 vs ITS-21 d; n = 5, GFAP: F3, 16 = 243.1, ***p < 0.001 vs ITS-7 d, ###p < 0.001 vs ITS-21 d). E Quantification of process length showed ITC reduced the process length of microglia at 7 and 21 d (n = 5, F3, 16 = 20.71, ***p < 0.001 vs ITS-7 d, ###p < 0.001 vs ITS-21 d). F Quantification of endpoint showed ITC decreased the endpoints in microglia at 7 and 21 d (n = 5, F3, 16 = 22.08, ***p < 0.01 vs ITS-7 d, ###p < 0.001 vs ITS-21 d). G Representative western blots of Iba-1 and GFAP expression in total proteins of the peri-thalamic lesion sites in naïve, ITS, and ITC rats. H Quantitative summary result showed ITC increased Iba-1 expression at 7 and 21 d, while ITS had no effect (n = 3, F4, 10 = 46.93, ***p < 0.001 vs ITS-7 d, ###p < 0.01 vs ITS-21 d). I Quantitative summary result showed ITC increased GFAP expression at 7 and 21d, while ITS had no effect (n = 3, F4, 10 = 33.41, ***p < 0.001 vs ITS- 7d, ###p < 0.001 vs ITS-21 d). J Representative western blots of HIF-1α and NLRP3 expression in total proteins of the peri-thalamic lesion sites in naïve, ITS, and ITC rats. K Quantitative summary result showed ITC increased HIF-1α expression at 7 and 21 d, while ITS had no effect (n = 3, F4, 10 = 91.24, ***p < 0.001 vs ITS-7 d, ###p < 0.001 vs ITS-21 d). L Quantitative summary result showed ITC increased NLRP3 expression at 7 and 21 d, while ITS had no effect (n = 3, F4, 10 = 67.22, ***p < 0.001 vs ITS-7 d, ###p < 0.001 vs ITS-21 d). Data are expressed as mean ± SEM, one-way ANOVA followed by Tukey test

