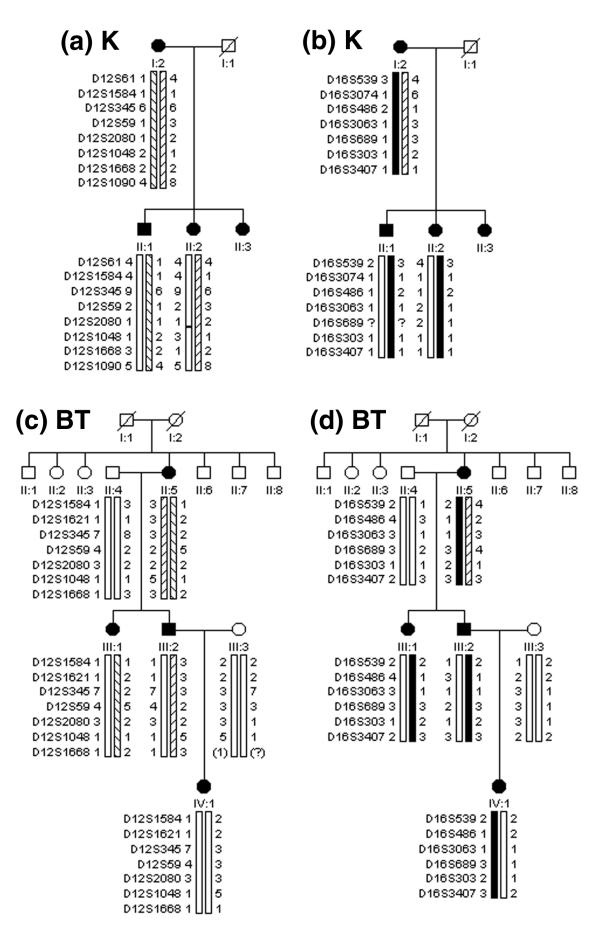
Figure 2.
Haplotype analysis for pedigrees K at the (a)FEOM1 and (b)FEOM3 loci and BT at the (c)FEOM1 and (d)FEOM3 loci. Symbols are defined in the legend to figure 1. In each family the CFEOM1 phenotype is co-inherited with FEOM3 markers and not with FEOM1 markers.

