
Figure 1: V. victoriae Standard Curve Development and Distribution.
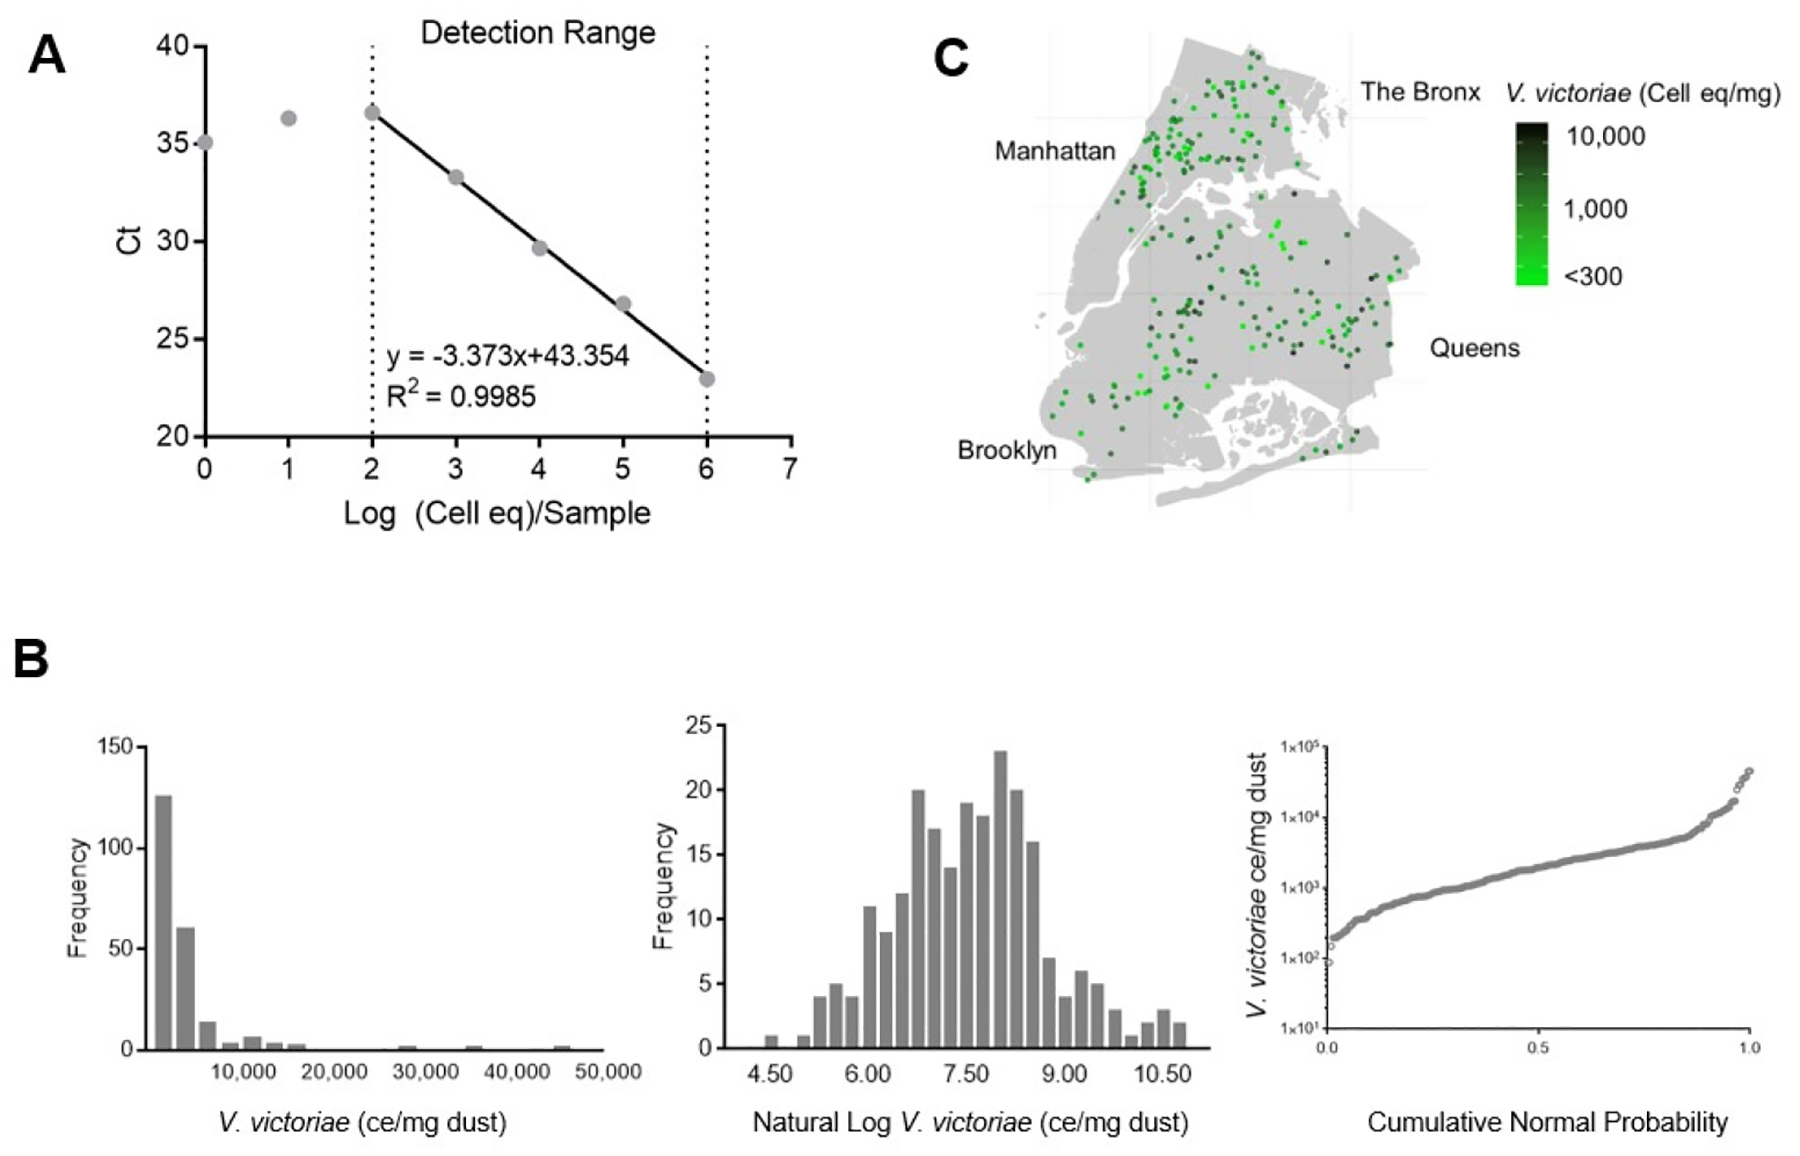
V. victoriae was quantified in samples utilizing a specific primer and probe set. A: The developed standard curve and range of detection. B: Numerical frequency distribution of V. victoriae quantifications in NYC Neighborhood Asthma and Allergy Study samples (left), log transformed quantifications (middle), and cumulative normal probability (right). C: Geographical distribution of V. victoriae ce/mg dust over the New York metropolitan area.