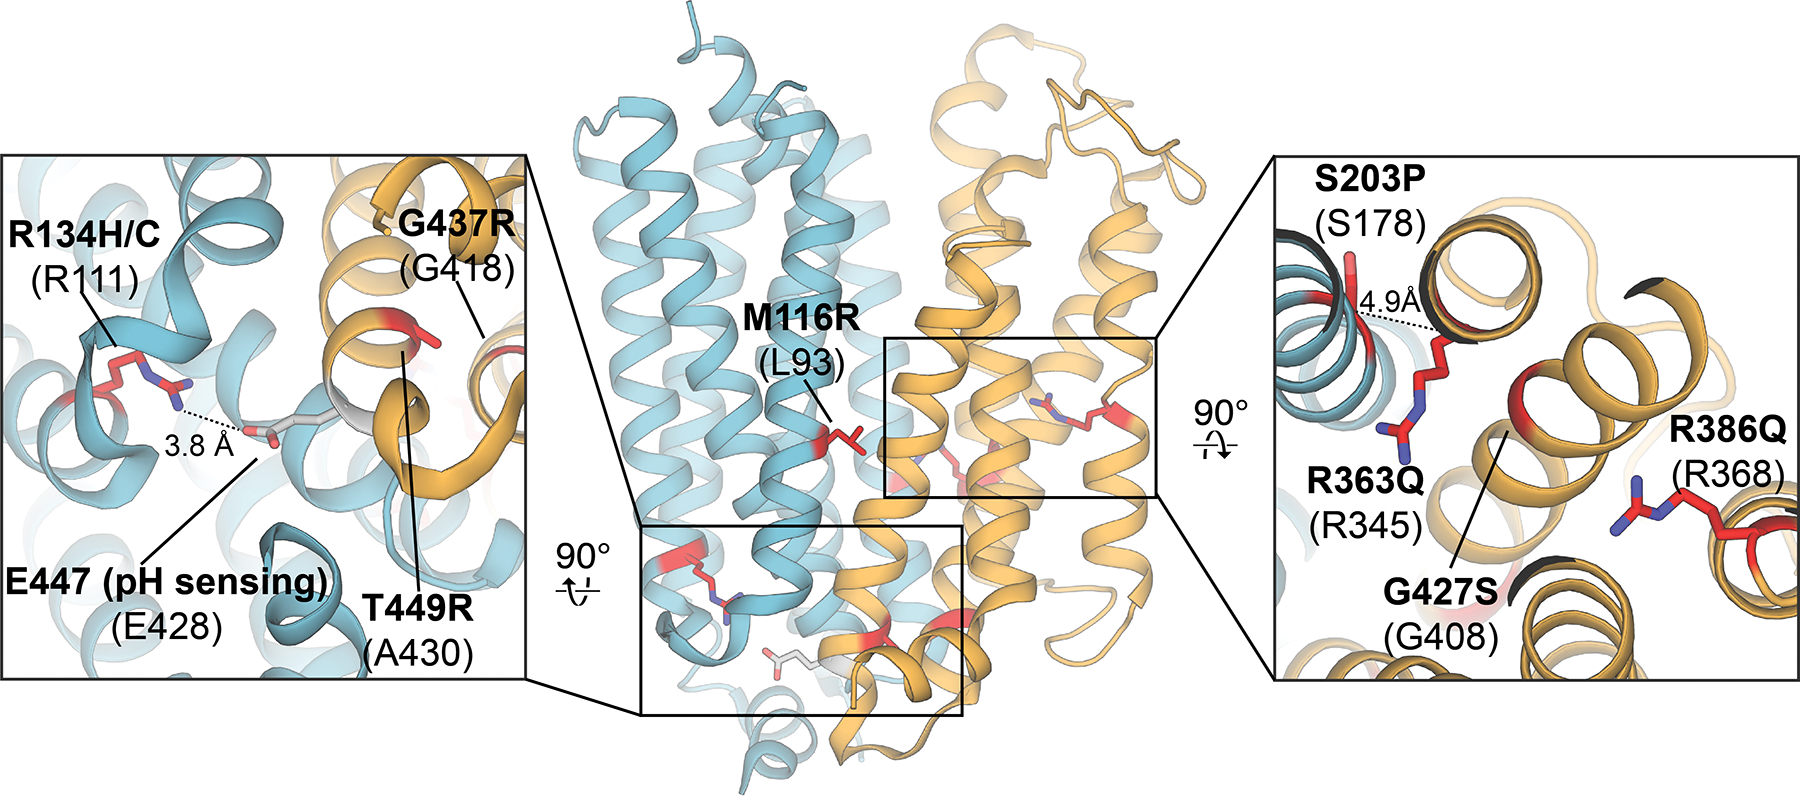
Figure 13.

Mapping of slc29a3 mutations associated with a broad spectrum of genetic disorders onto their corresponding conserved positions in the human ENT1 crystal structure (PDB ID 6OB7; mutation sites highlighted in red, pH sensing residue highlighted in grey). Mutations in human ENT3 are labeled in bold, and the corresponding conserved positions in human ENT1 are listed below in parentheses.
