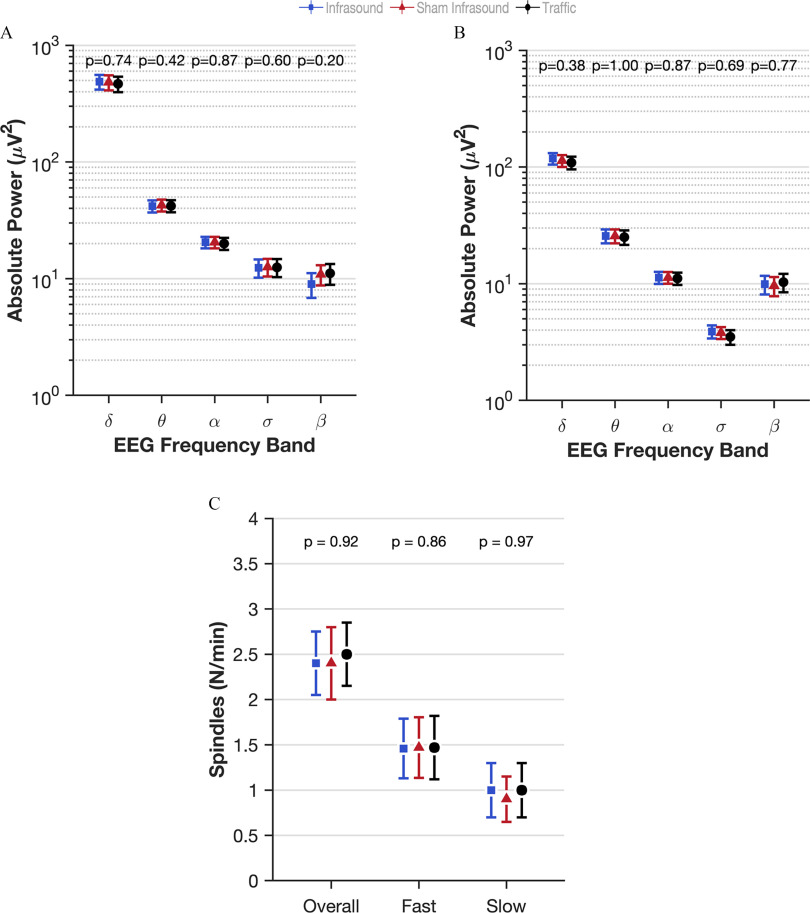
Figure 3.
Effect estimates of infrasound and traffic on quantitative measures of electroencephalography during sleep in the laboratory-based study of the three-arm crossover study of 72 h of exposure to simulated wind turbine infrasound, sham infrasound, and traffic noise. Infrasound is represented in blue squares, sham infrasound in red triangles, and traffic noise in black circles. Absolute power derived from overnight electrophysiology transformed into five frequency bands as a measure of cortical activity in (A) NREM and (B) REM (delta , theta , alpha sigma , beta ). Sleep spindle density in NREM overall and density of fast and slow spindles in NREM. (C) Fast and slow . Numerical values above each plot are the -values for the difference between infrasound and sham infrasound. Effects estimates are derived from mixed models of repeated measures where the participants were classed as random effects and exposure (3 levels), the order the exposure was received (1, 2, 3), the night of exposure (1, 2, 3), and interactions between the exposure by night and night by order as fixed effects. The least squares means procedure was used to address missing data. The exact numerical values for the estimated means and 95% CIs can be found in Table S3. Point estimates are indicated graphically by the shapes and 95% CIs indicated by the bars. Note: CI, confidence interval; NREM, non-REM sleep; REM, rapid eye movement sleep.

