
Figure 3. Btz-BPD provides significant therapeutic enhancements over Btz in subcutaneous (A-D) and aggressive orthotopic models (E-H) of MM.
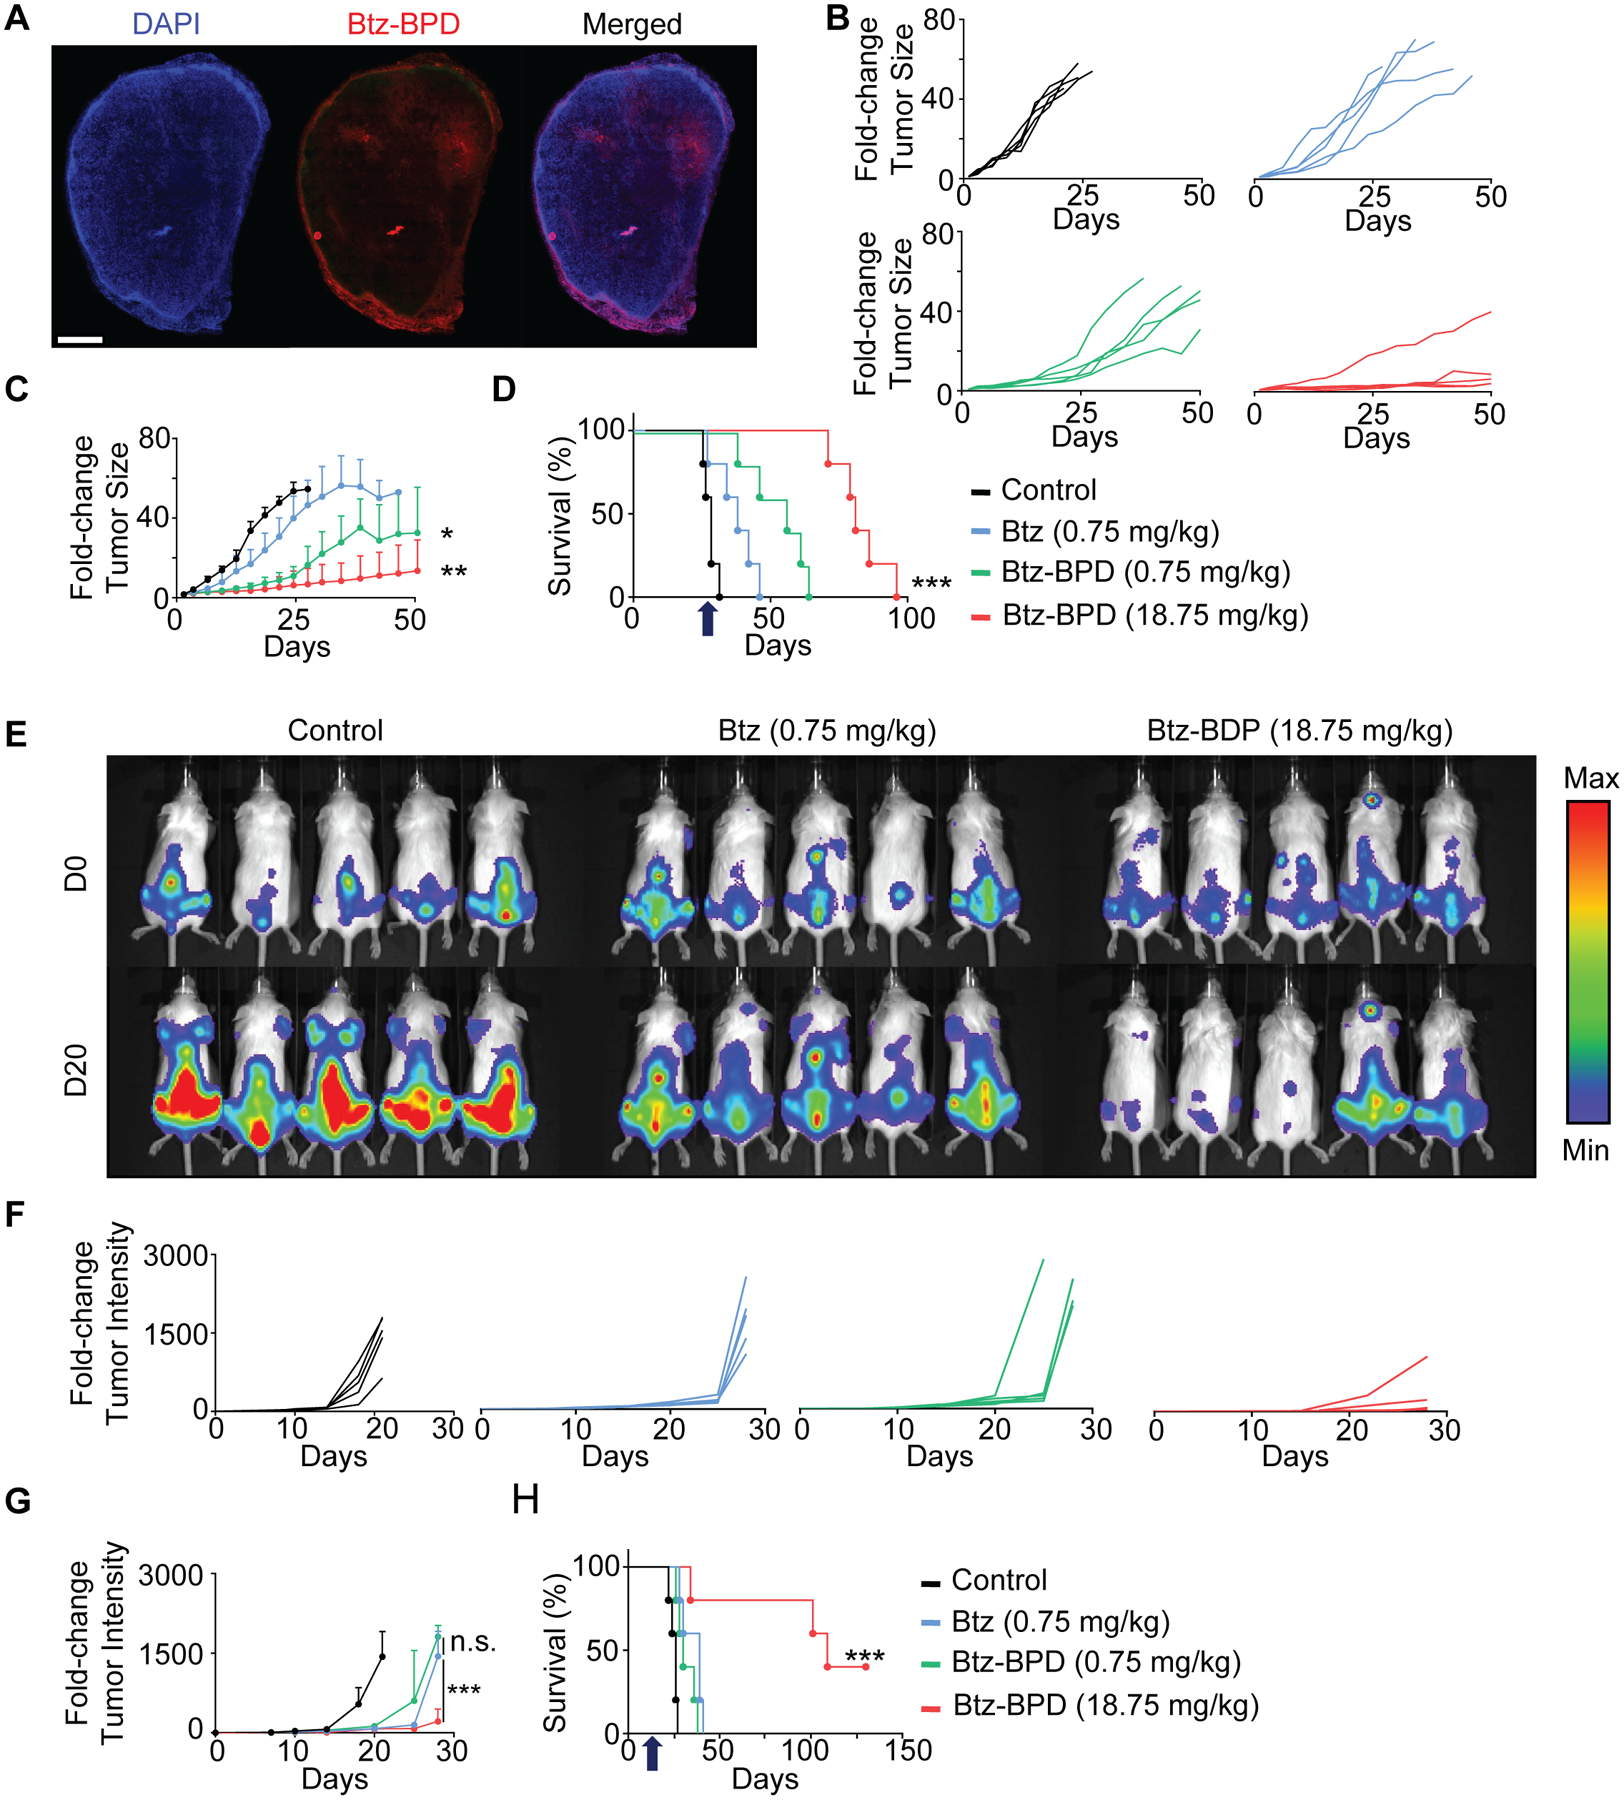
(A) Evaluation of tumor accumulation and penetration of Cy5.5-labelled Btz-BPD at 1 h post-administration (i.v.) as assessed by fluorescence microscopy of harvested tumor upon animal euthanasia (scale bar = 200 μm); representative micrograph is shown, and similar results were acquired in 3 independent biological samples. For efficacy evaluation, KMS11 subcutaneous tumor-bearing mice were injected with PBS, Btz, or Btz-BPD, starting when their tumors reached 5 mm in the largest axis. (B) Spider plots of tumor growth and (C) average tumor size (± SEM) over the course of the study (n = 5 mice per group). Statistical analysis was performed by using a two-tailed t-test between the Btz and Btz-BPD groups. P = 0.0025— Btz-BPD (18.75 mg/kg) vs. Btz (0.75 mg/kg), P = 0.0325— Btz-BPD (0.75 mg/kg) vs. Btz (0.75 mg/kg). (D) Kaplan-Meier survival curves, revealing significant enhancements in therapeutic outcomes for animals treated with Btz-BPD vs. Btz at equivalent doses and with further improvements based on increased Btz-BPD dose level. Arrow indicates the last administered dose. Statistical analysis was performed by using a Log-Rank test, P < 0.0002. (E) Bioluminescence imaging of MM.1SLUC+/GFP+ cells after intravenous dissemination and as a function of the time (day 0 vs. day 20) after administration of PBS (control), Btz (0.75 mg/kg), or Btz-BDP (18.75 mg//kg). (F) Individual spider plots and (G) average tumor size (± SEM) over the course of the study (n = 5 mice per group). Statistical analysis was performed by using a two-tailed t-test between the Btz-BPD and Btz groups. P = 0.0002— Btz-BPD (18.75 mg/kg) vs. Btz-BPD (0.75 mg/kg), P = 0.0525— Btz-BPD (0.75 mg/kg) vs. Btz (0.75 mg/kg). (H) Kaplan-Meier survival curves confirm significant enhancements in the therapeutic outcomes for animals treated at the high dose of Btz-BPD (18.75 mg/kg) as when compared to those treated at the MTD of Btz (0.75 mg/kg). Arrow indicates the last administered dose. Statistical analysis was performed by using a Log-Rank test, P = 0.0002. For statistical tests, ns: non-significant, *: P<0.05, **: P<0.01, ***: P<0.001.