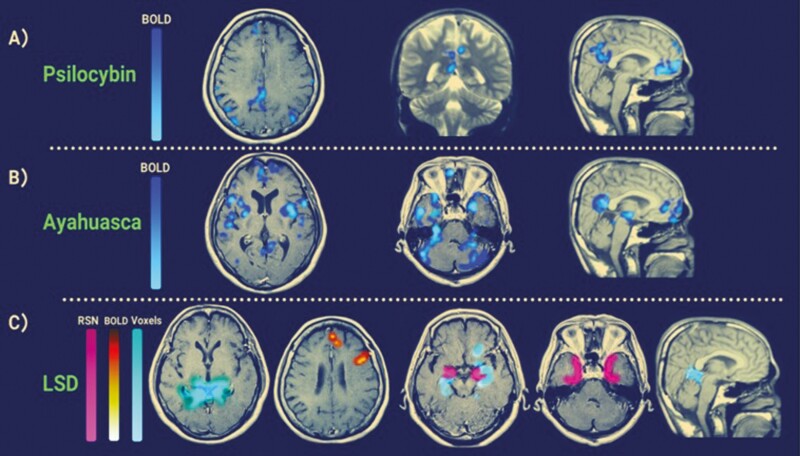
Figure 3.
fMRI activity patterns of the various psychedelics on regions of the DMN. (A) Blue BOLD signals represent significant brain deactivations after psilocybin compared with placebo (adapted from Carhart-Harris et al., (2016)). (B) Significant BOLD decreases of the DMN after the ingestion of Ayahuasca (adapted from Palhano-Fontes et al., (2015)). (C) Between-group differences (LSD vs placebo) in the FC between a key DMN node (bilateral hippocampal seed) and the rest of the brain. Orange represents increases in FC between the seed at the parahippocampus, and cyan/blue signifies decreases. Pink is a mask of the parahippocampal gyrus [adapted from Carhart-Harris et al., (2016)]. This figure is used to help visually compare and contrast the heterogeneity of activity patterns between 3 foundational studies, but it should be noted that other neuroimaging studies exist that are not included. Blood-oxygen-level-dependent (BOLD), Default mode network (DMN), Functional connectivity (FC).

