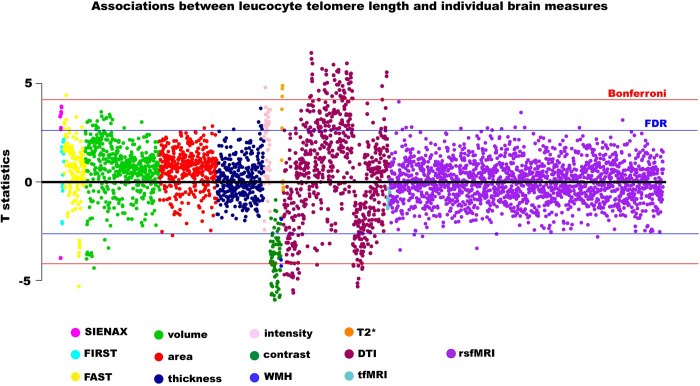
Fig 1. Associations between leucocyte telomere length and individual imaging-derived phenotypes.
Estimates were generated from regression models adjusted for: full set of imaging-related confounders, age, age2, age3, sex, age*sex, body mass index, smoking, alcohol intake, leucocyte count, genetic ancestry. Blue line indicates False Discovery Rate threshold (3921 tests, p = 4.12x10⁻³, T statistic = 2.64), red line indicates Bonferroni threshold (3921 tests, p = 1.28x10⁻⁵, T statistic = 4.21). Abbreviations: IDP–image-derived phenotypes, dMRI–diffusion imaging, WMH–white matter hyperintensities, rsfMRI–resting state functional magnetic resonance imaging, tfMRI–task functional magnetic resonance imaging.

